Stocks managed to rally again, and because of the speed of the rally over the last two days, it took the NASDAQ 100 into an overbought position, with the index crossing above the upper Bollinger Band and the RSI rising to 70. We have seen these conditions before, and we know that when these things tend to happen, the asset consolidates sideways or pulls back. It also seems like a reasonable place for resistance, given the prior support/resistance in this region.
Hard to believe that the indexes were oversold a month ago.
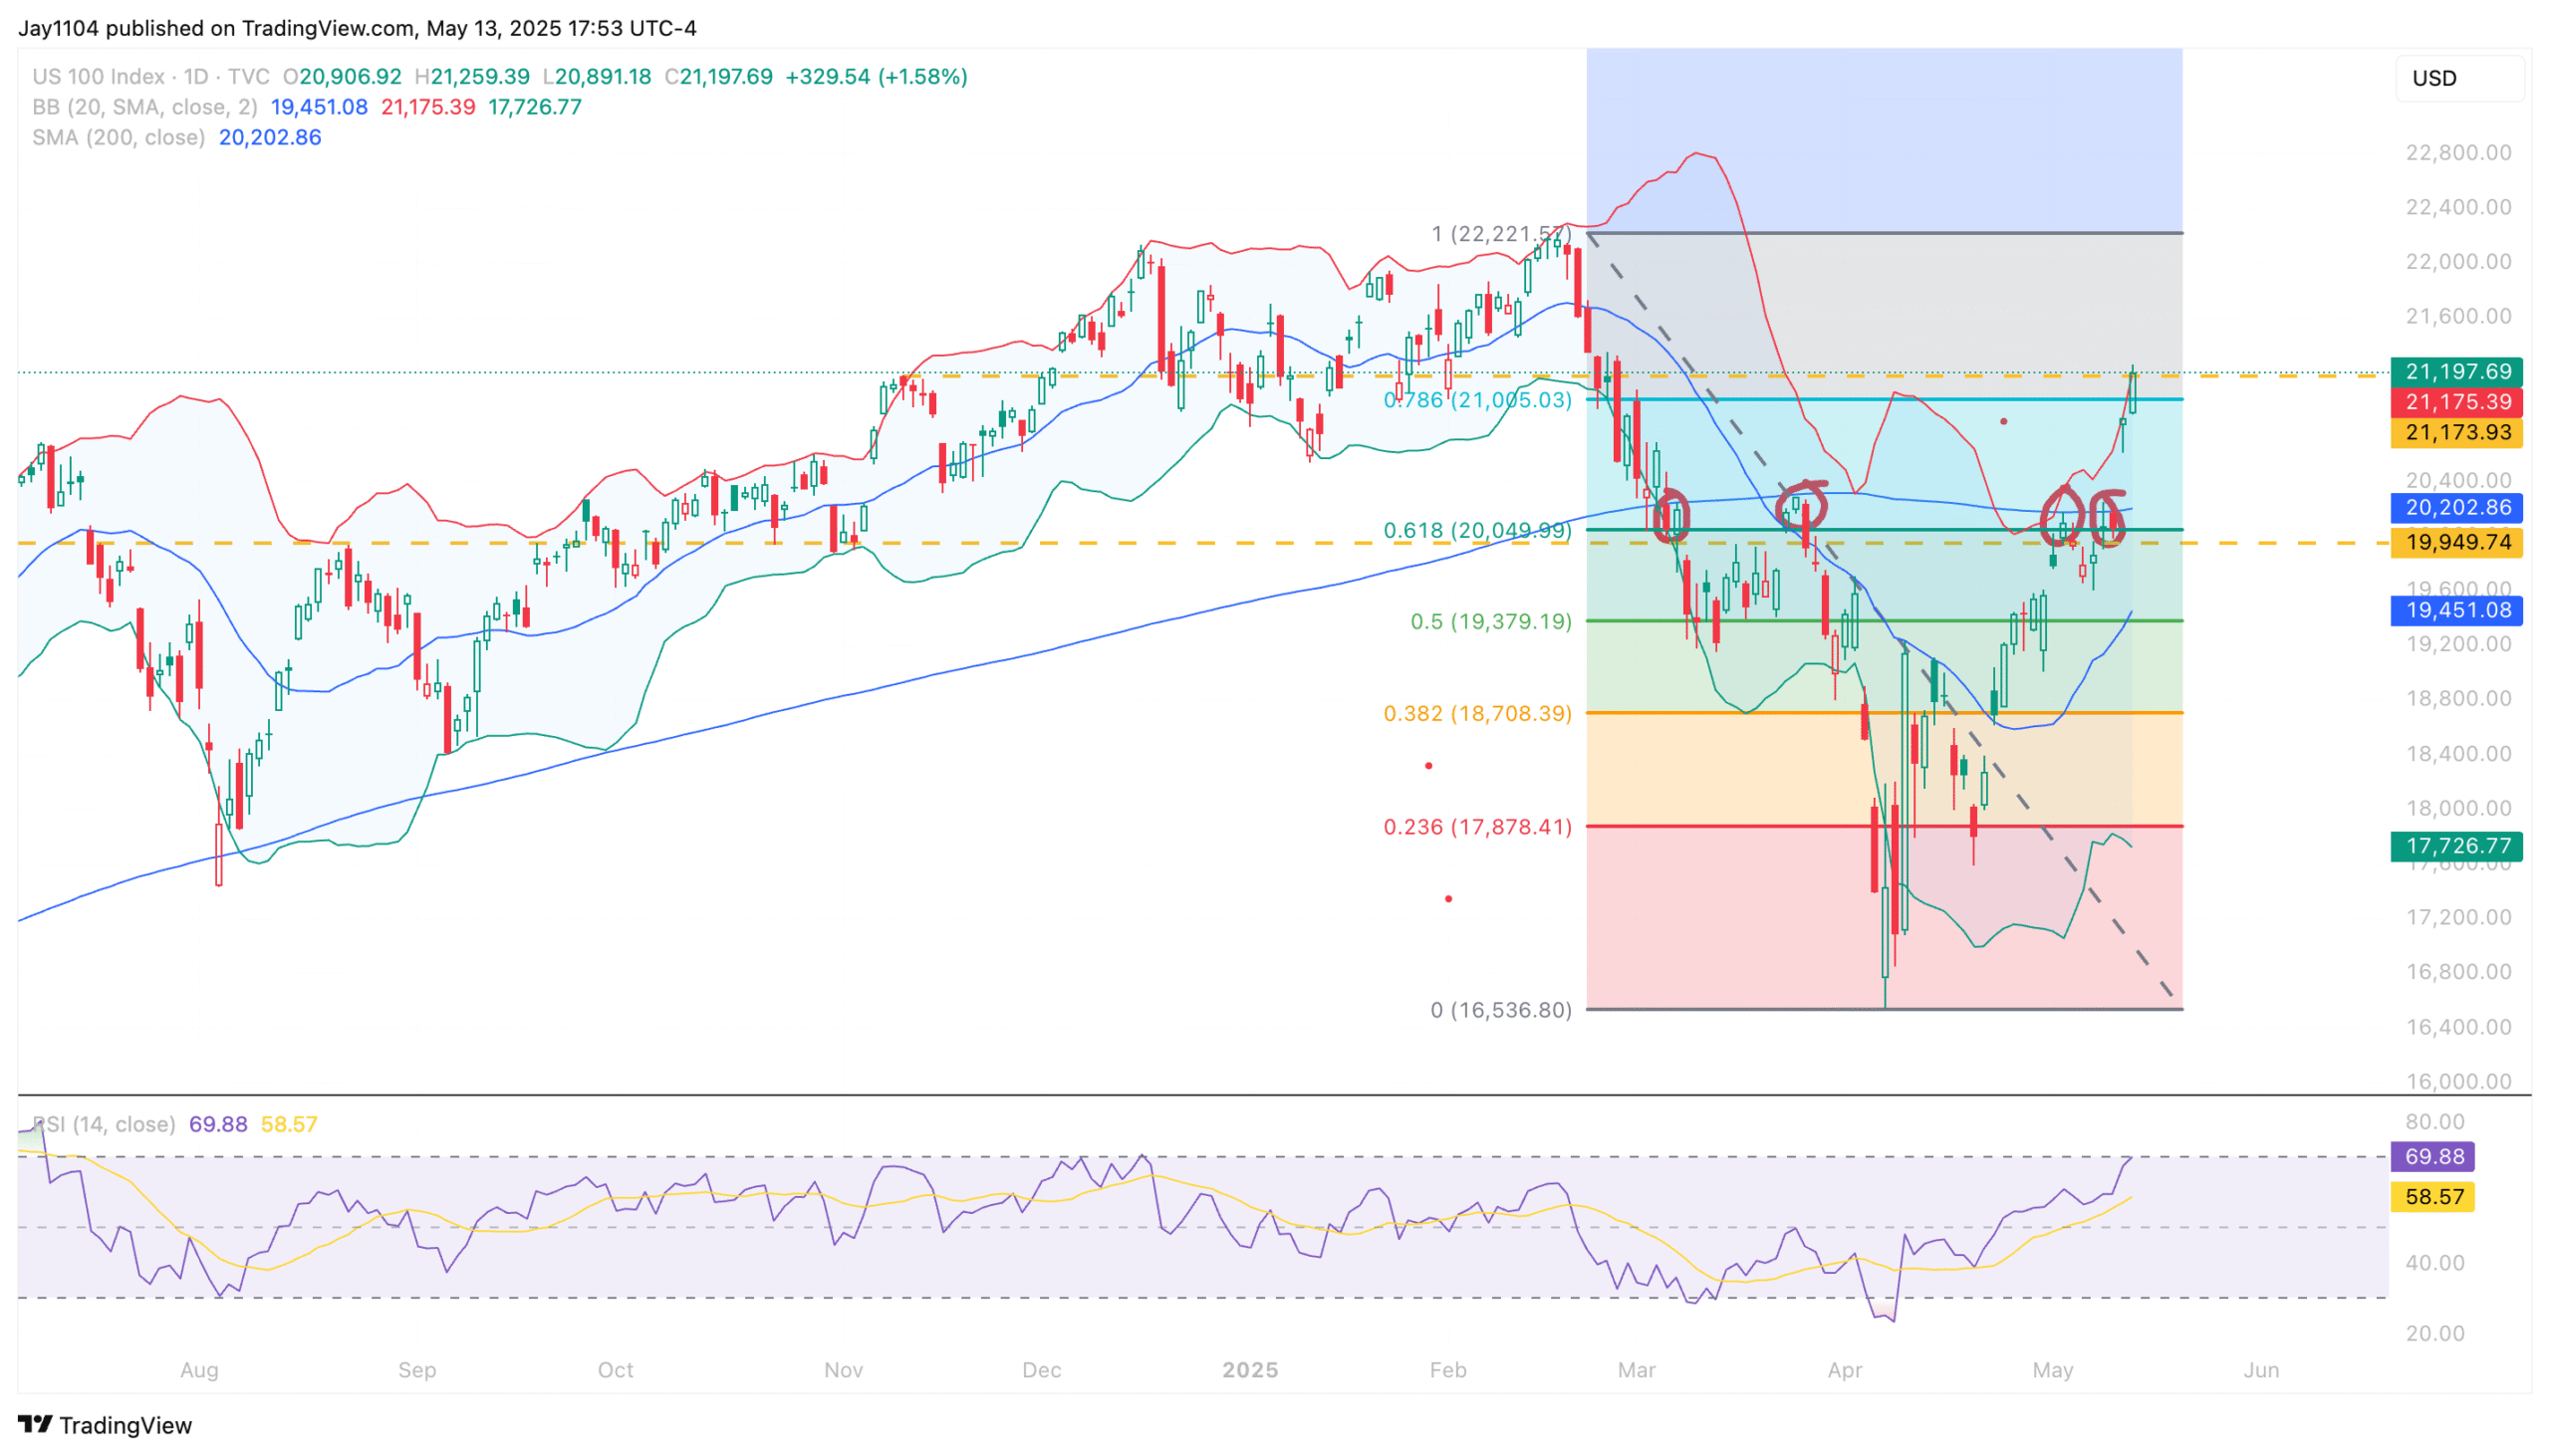
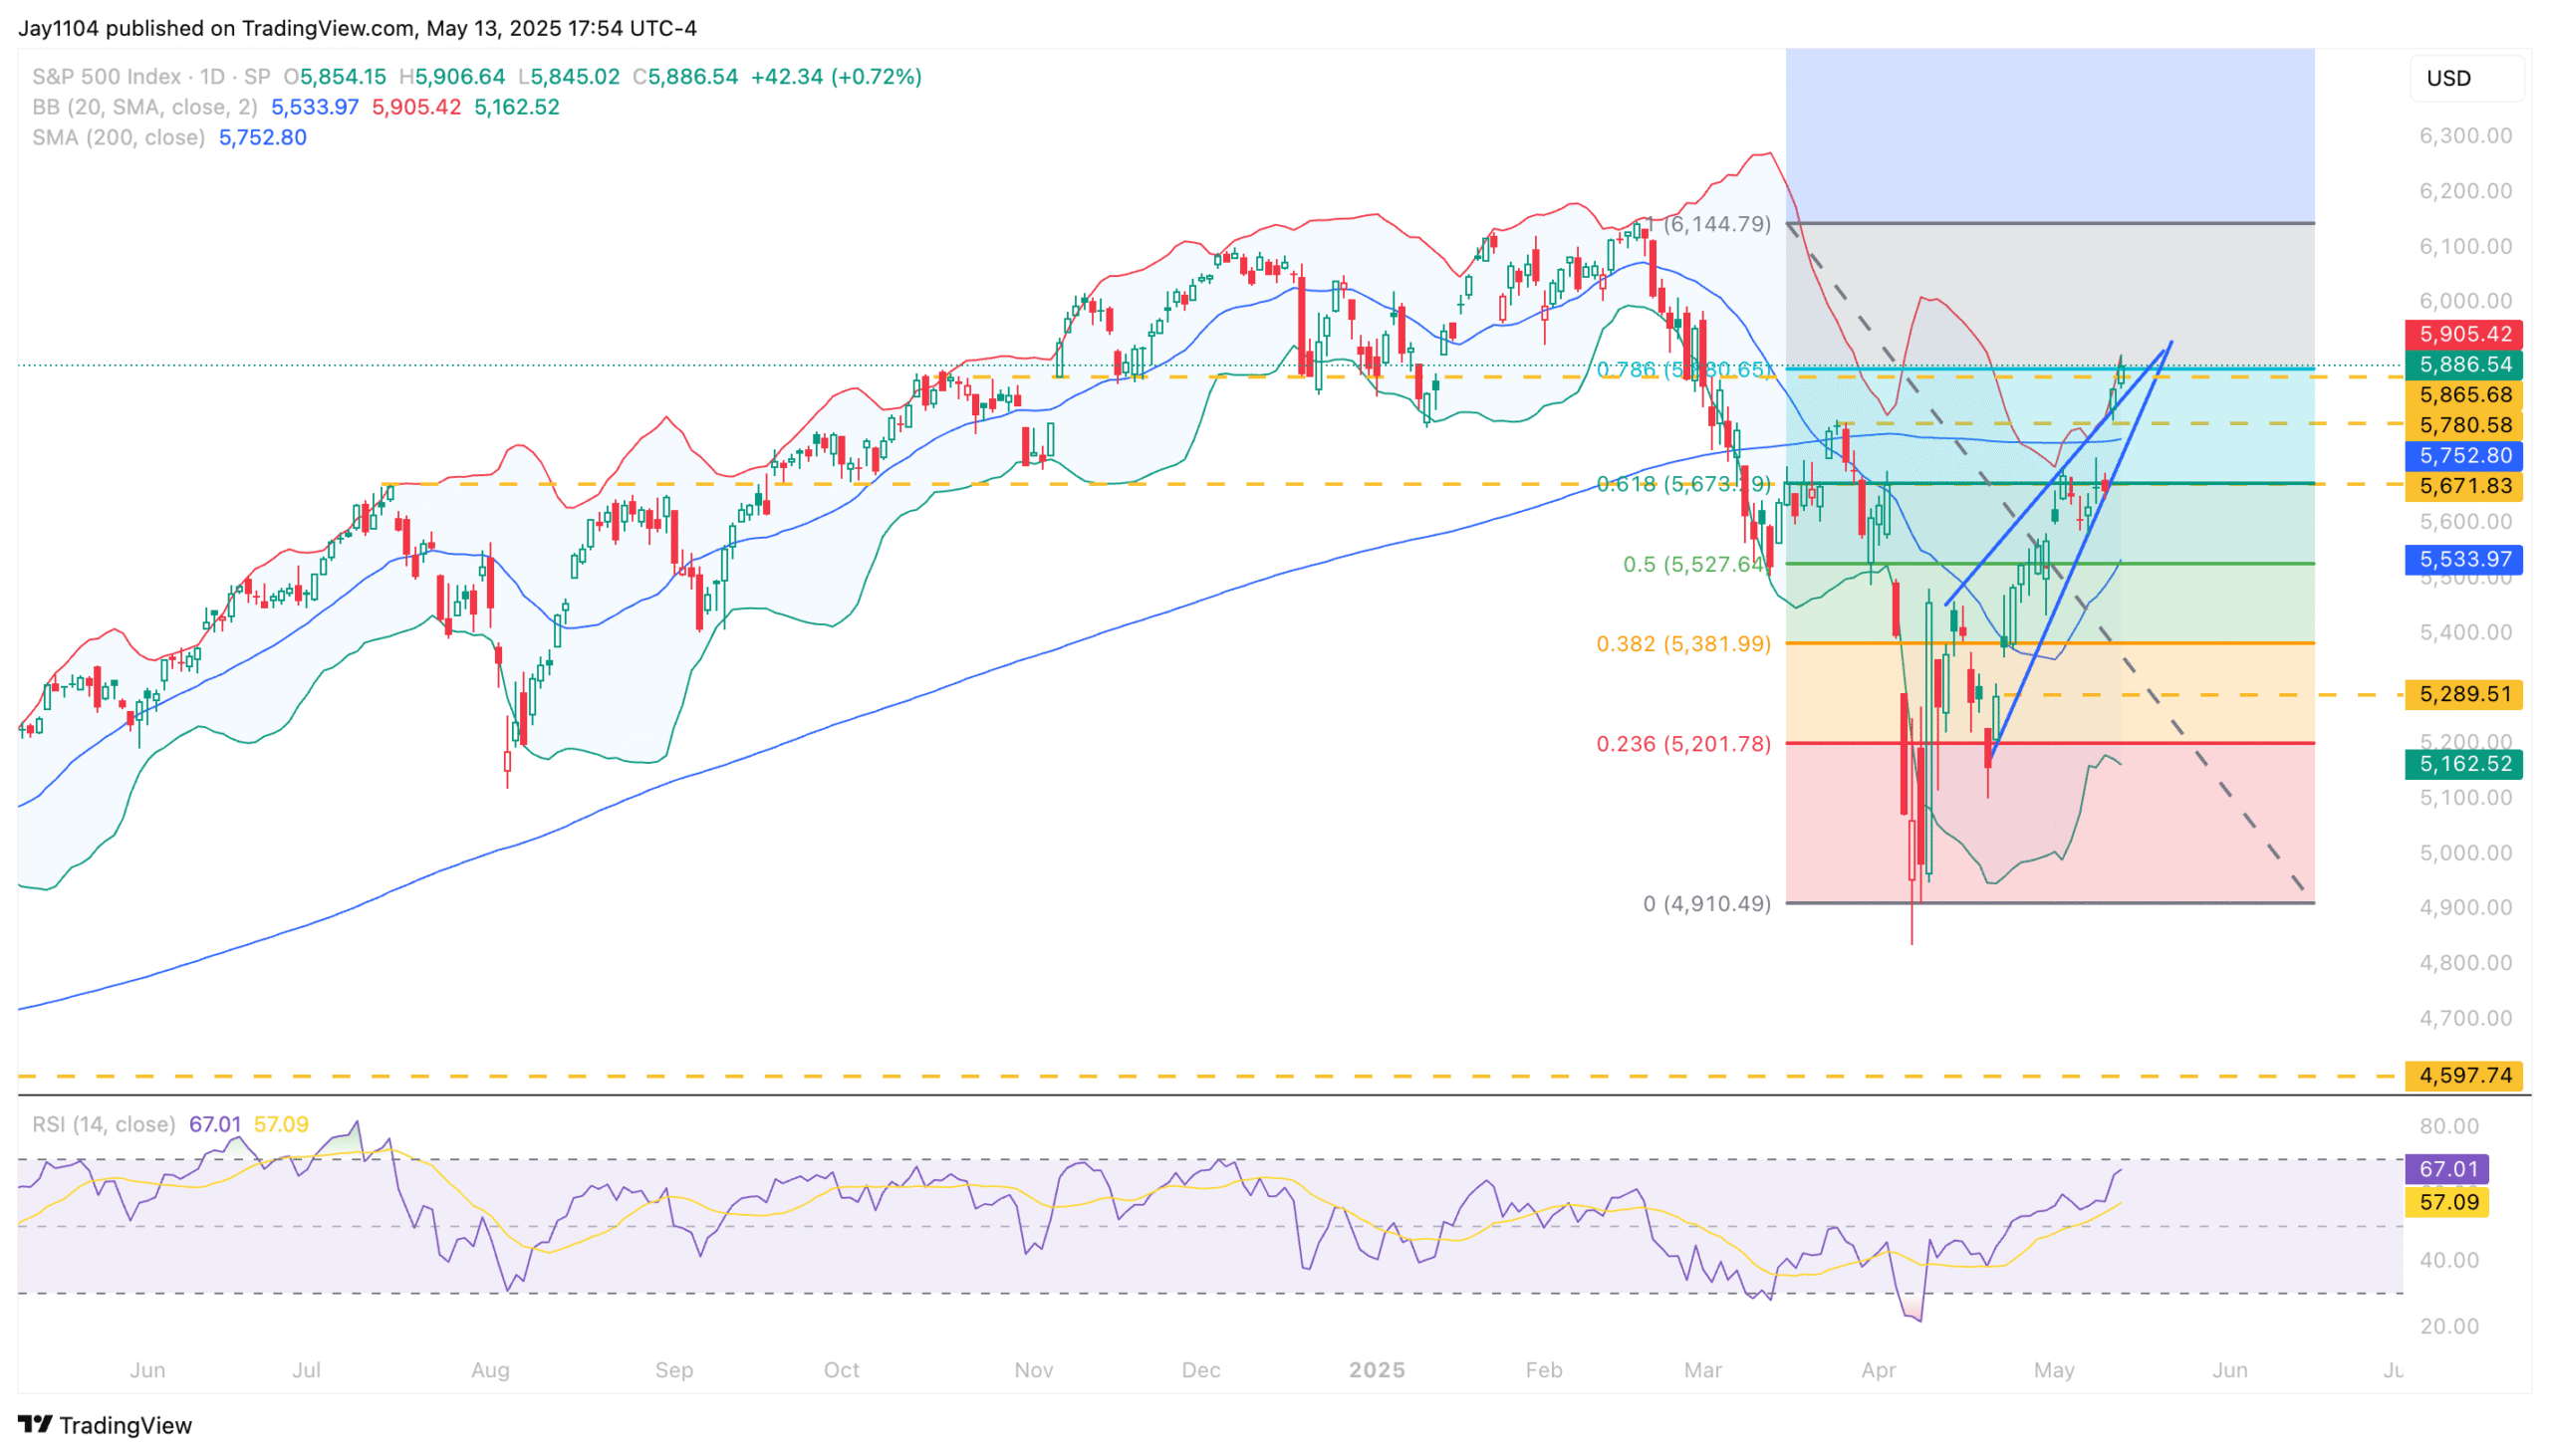
It is similar to the S&P 500 ; add in the fact that the index reached the 78.6% retracement level. So, just like last week, which presented that opportunity at 61.8%, this week presents a new opportunity. The facts are that both indices are at the upper end of their Bollinger bands, with the NASDAQ at 70 on the RSI and the S&P 500 nearing 70.
The 78.6% retracement level is also present for the S&P 500; there is no denying that. So when you start seeing multiple indicators pointing to something, it becomes hard to ignore.
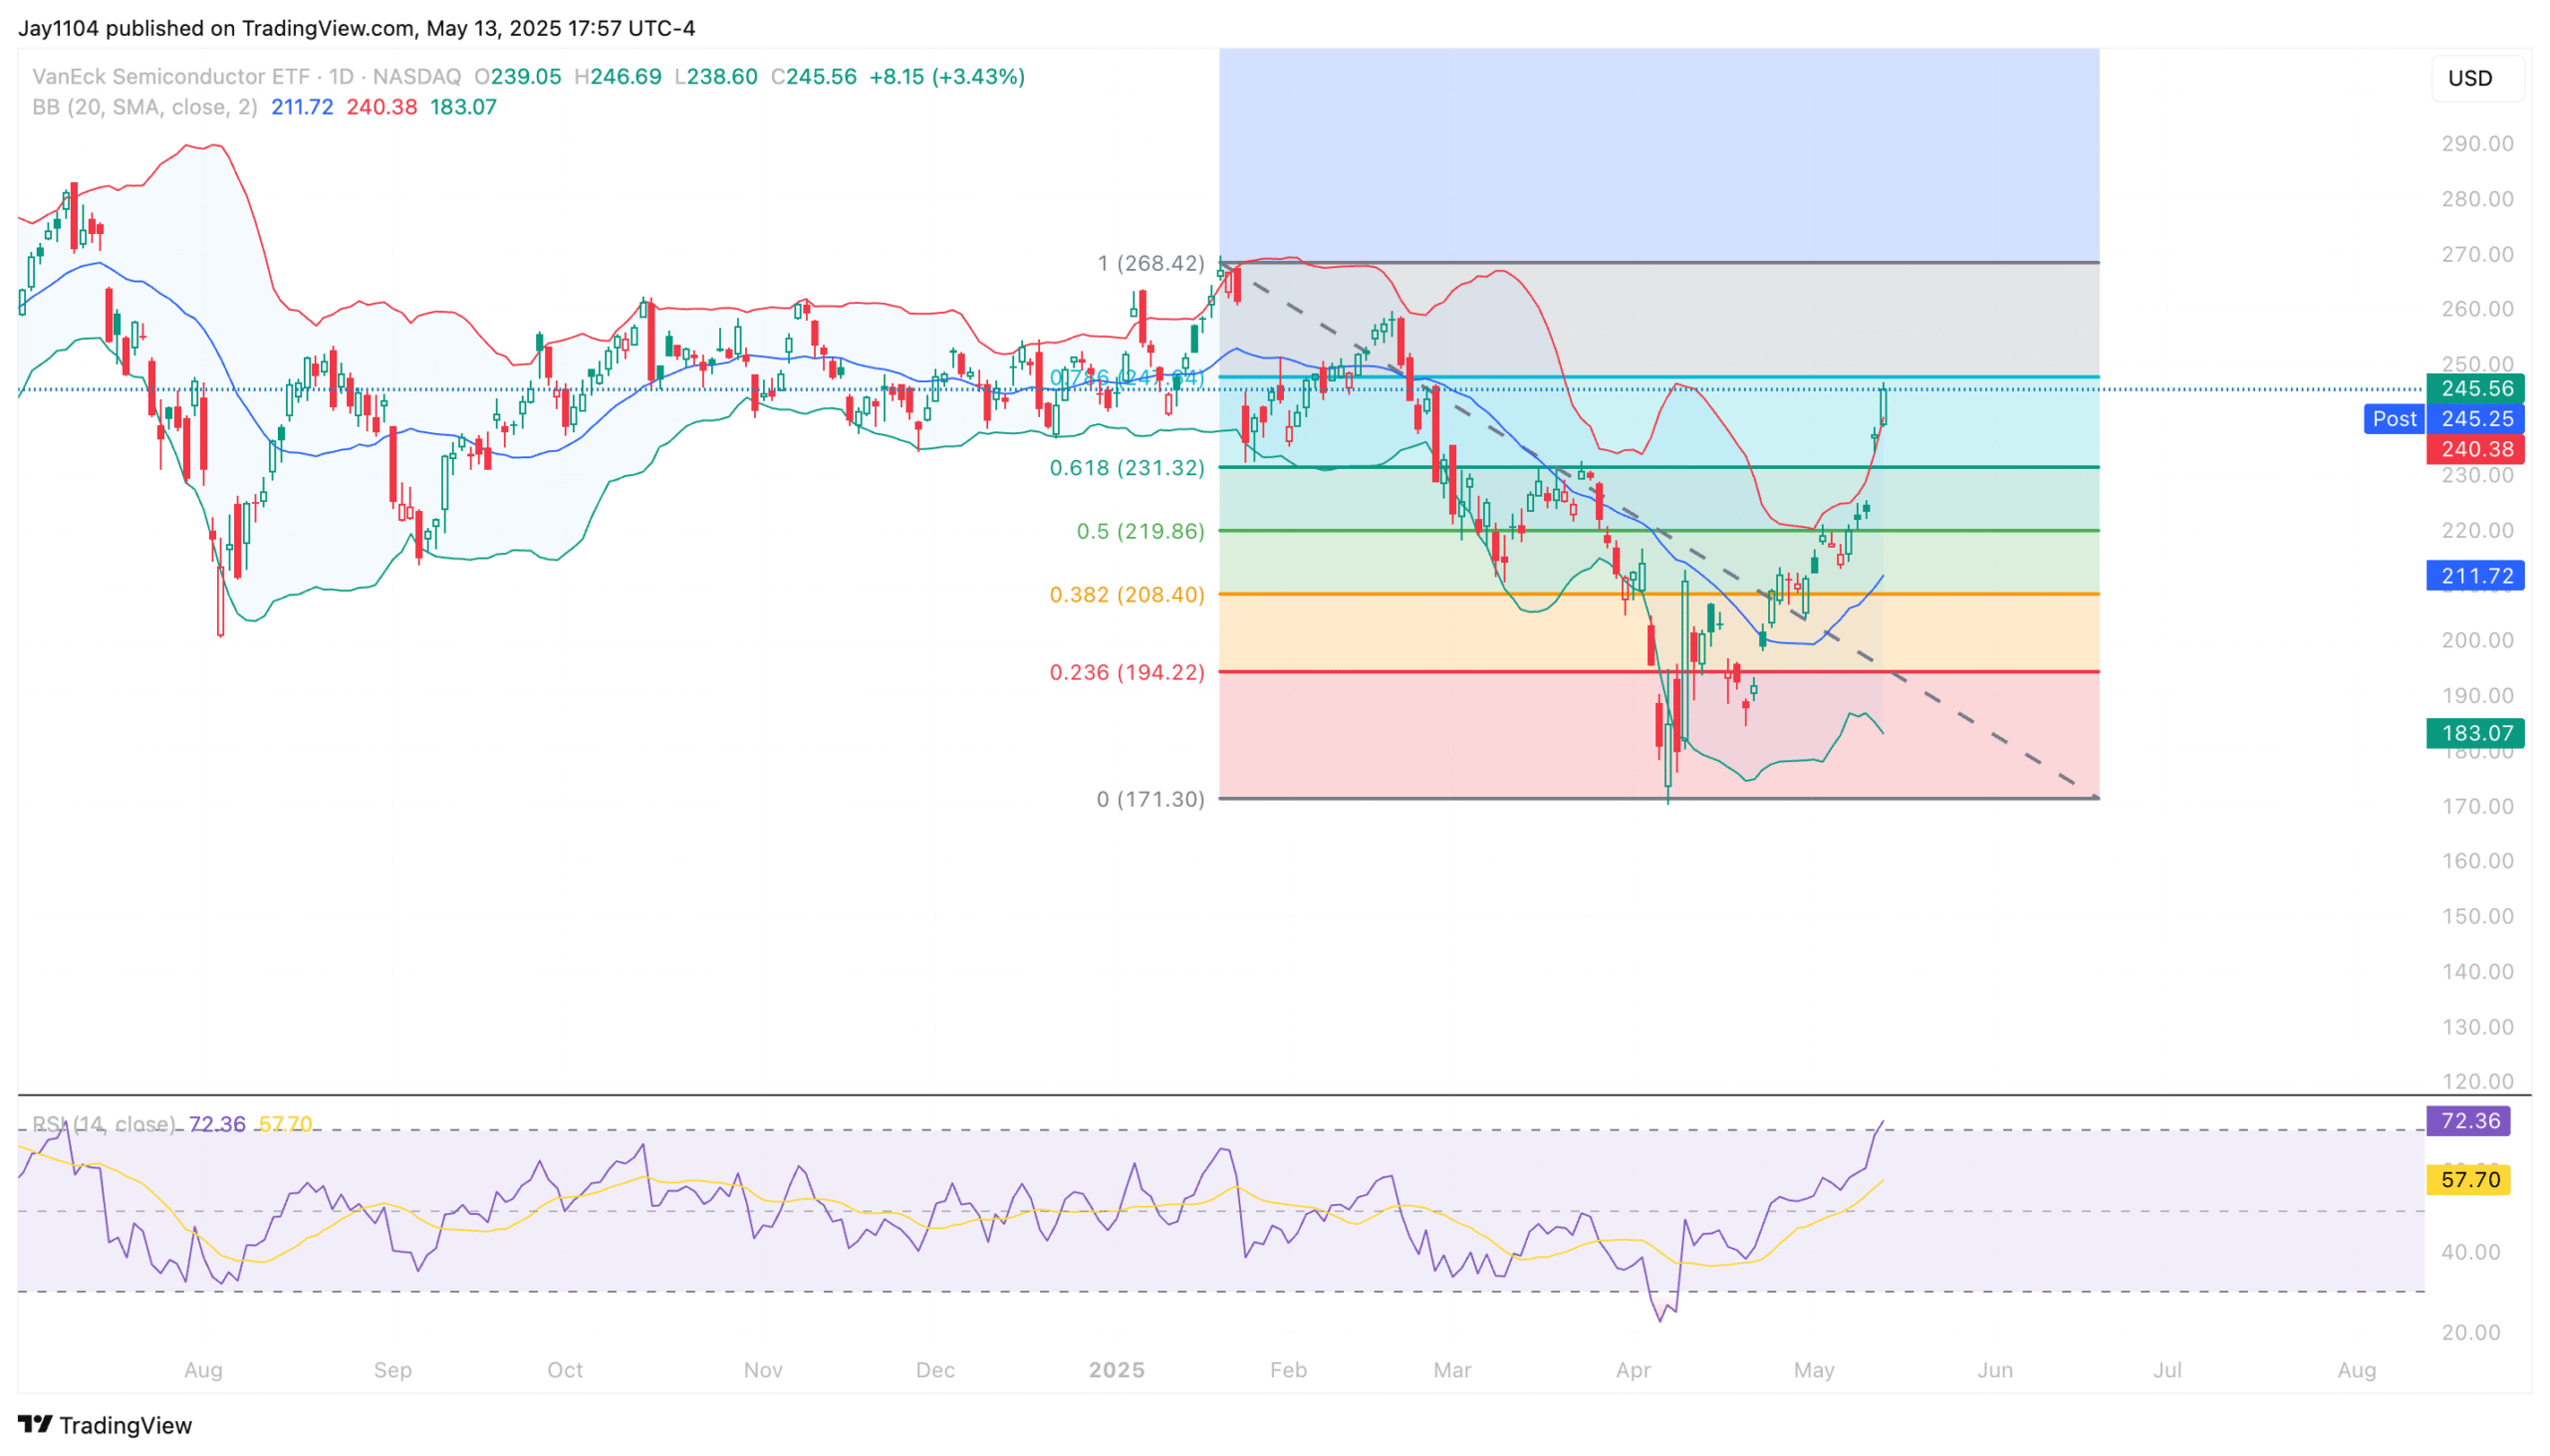
It is the same story for the Semi
SMH ETF
.
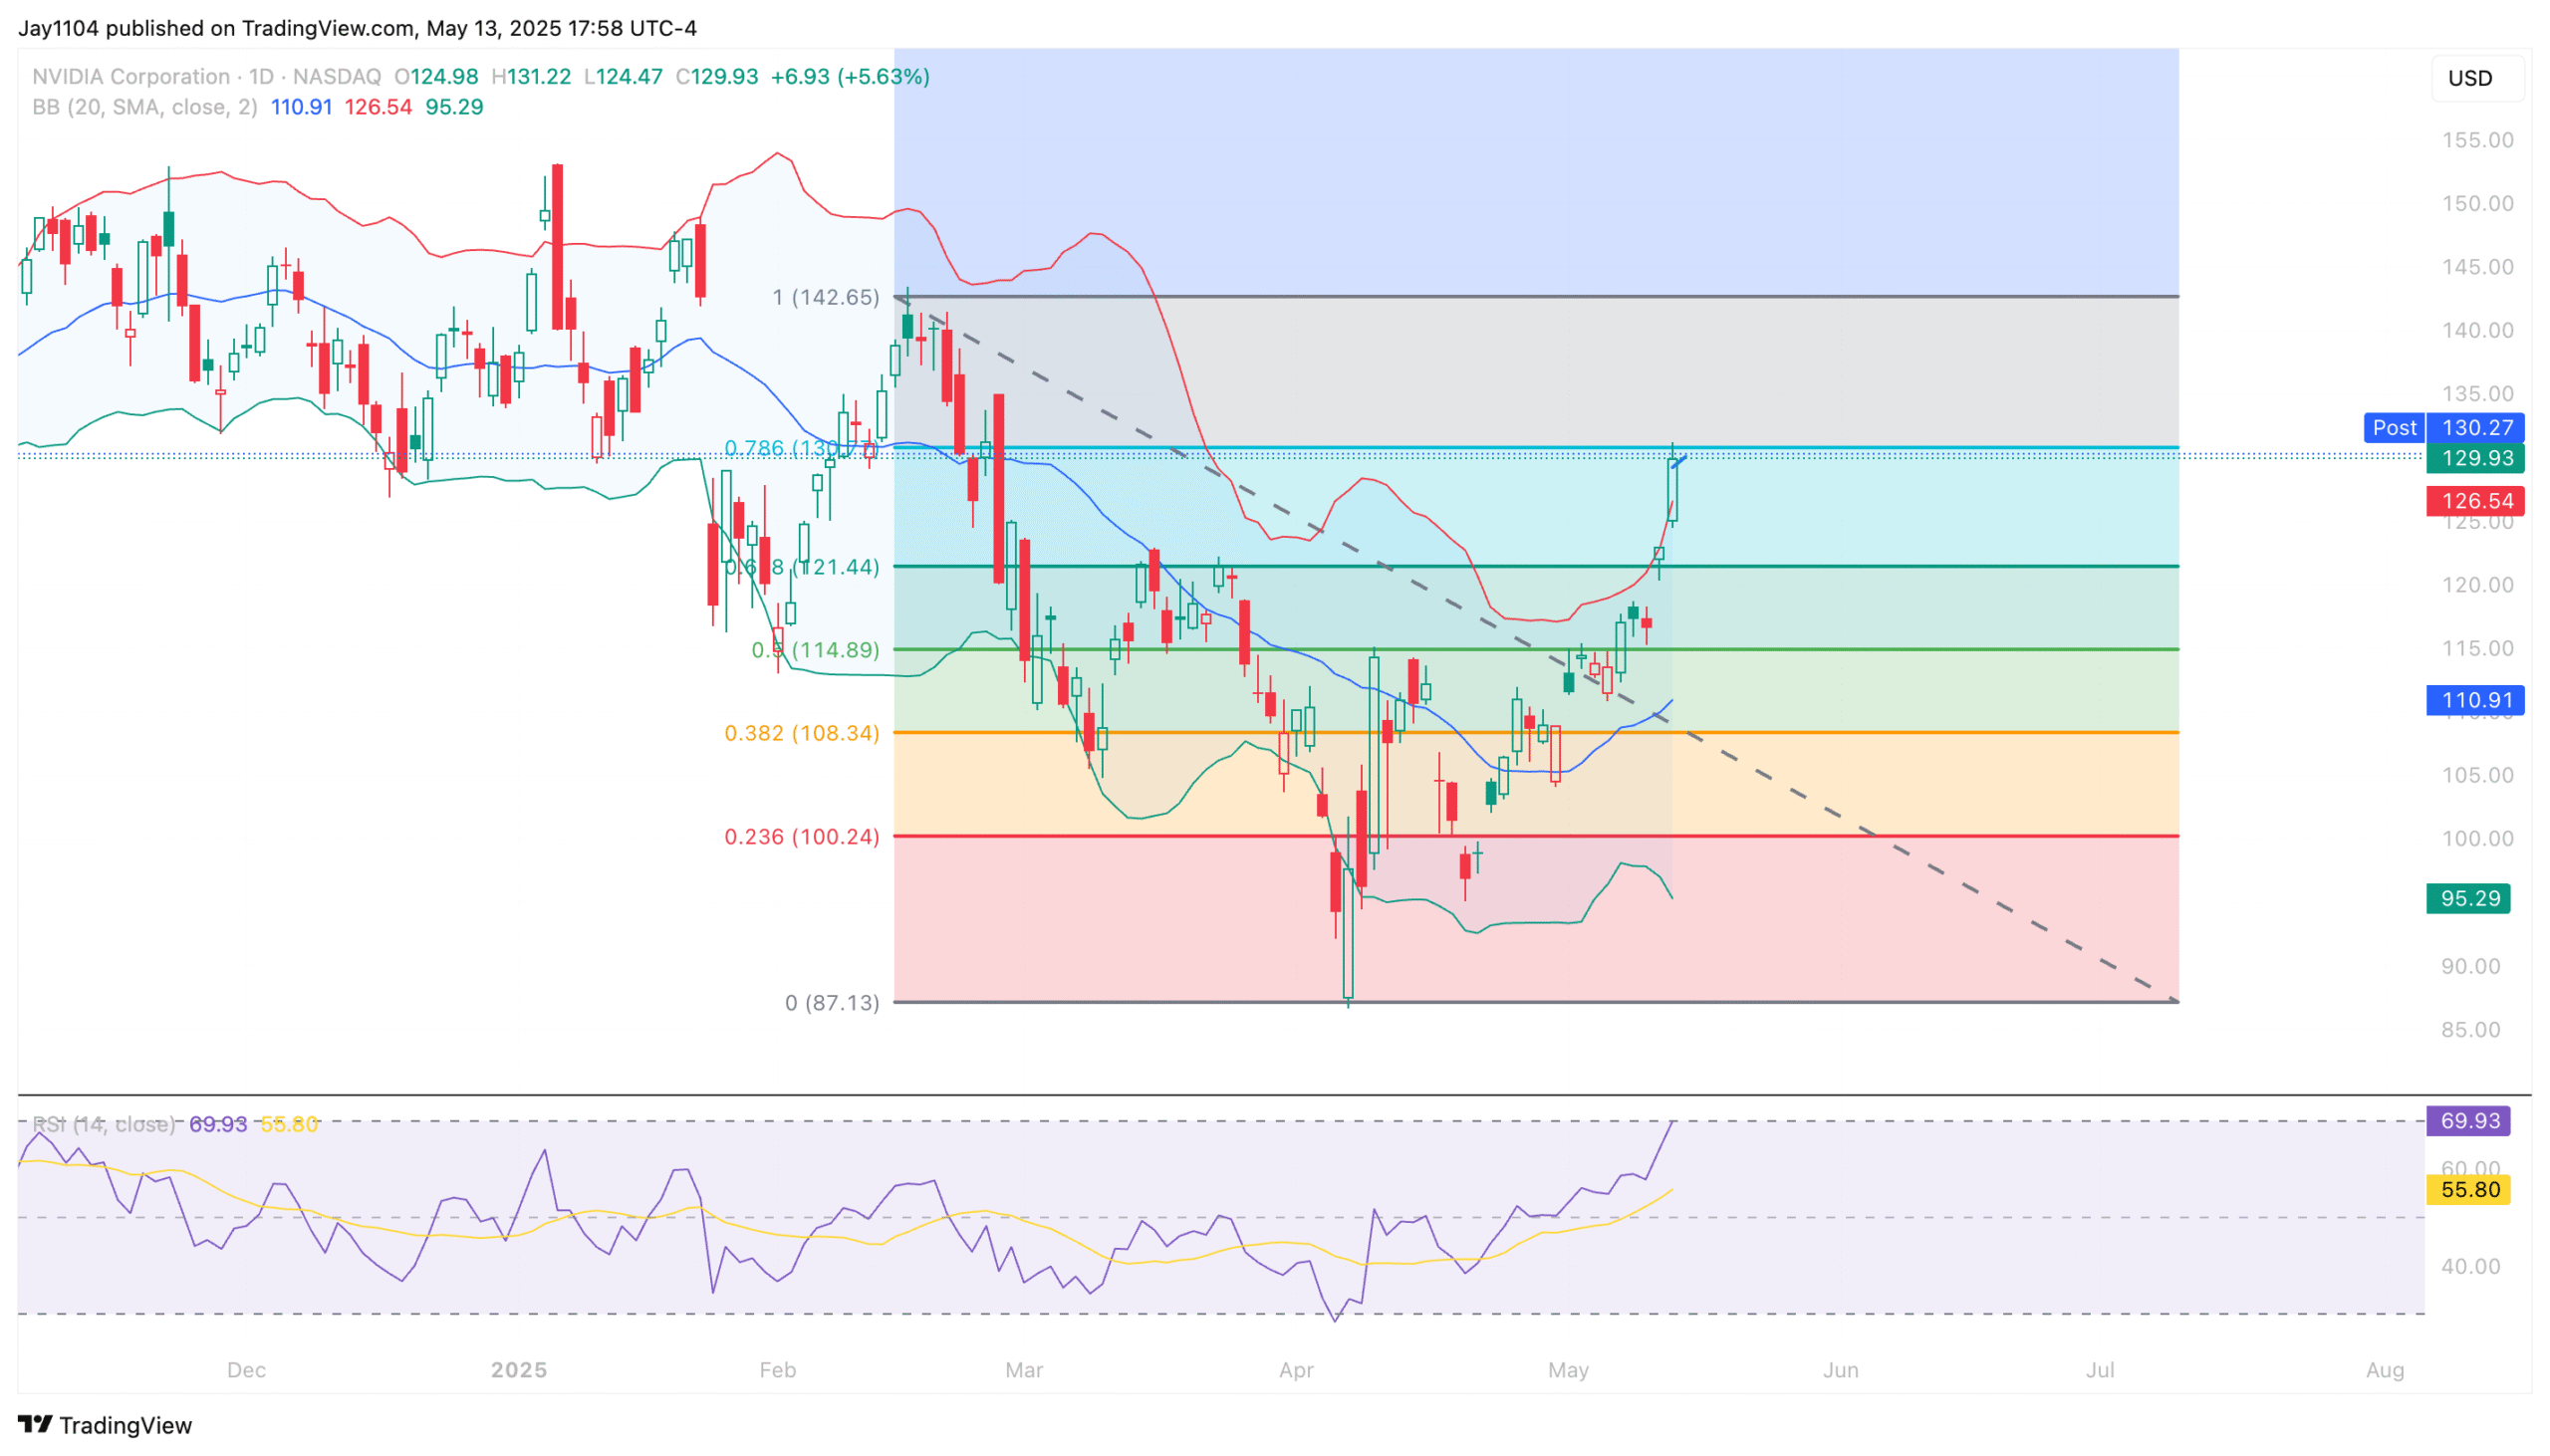
Nvidia (NASDAQ:
NVDA
) finds itself in a similar spot.
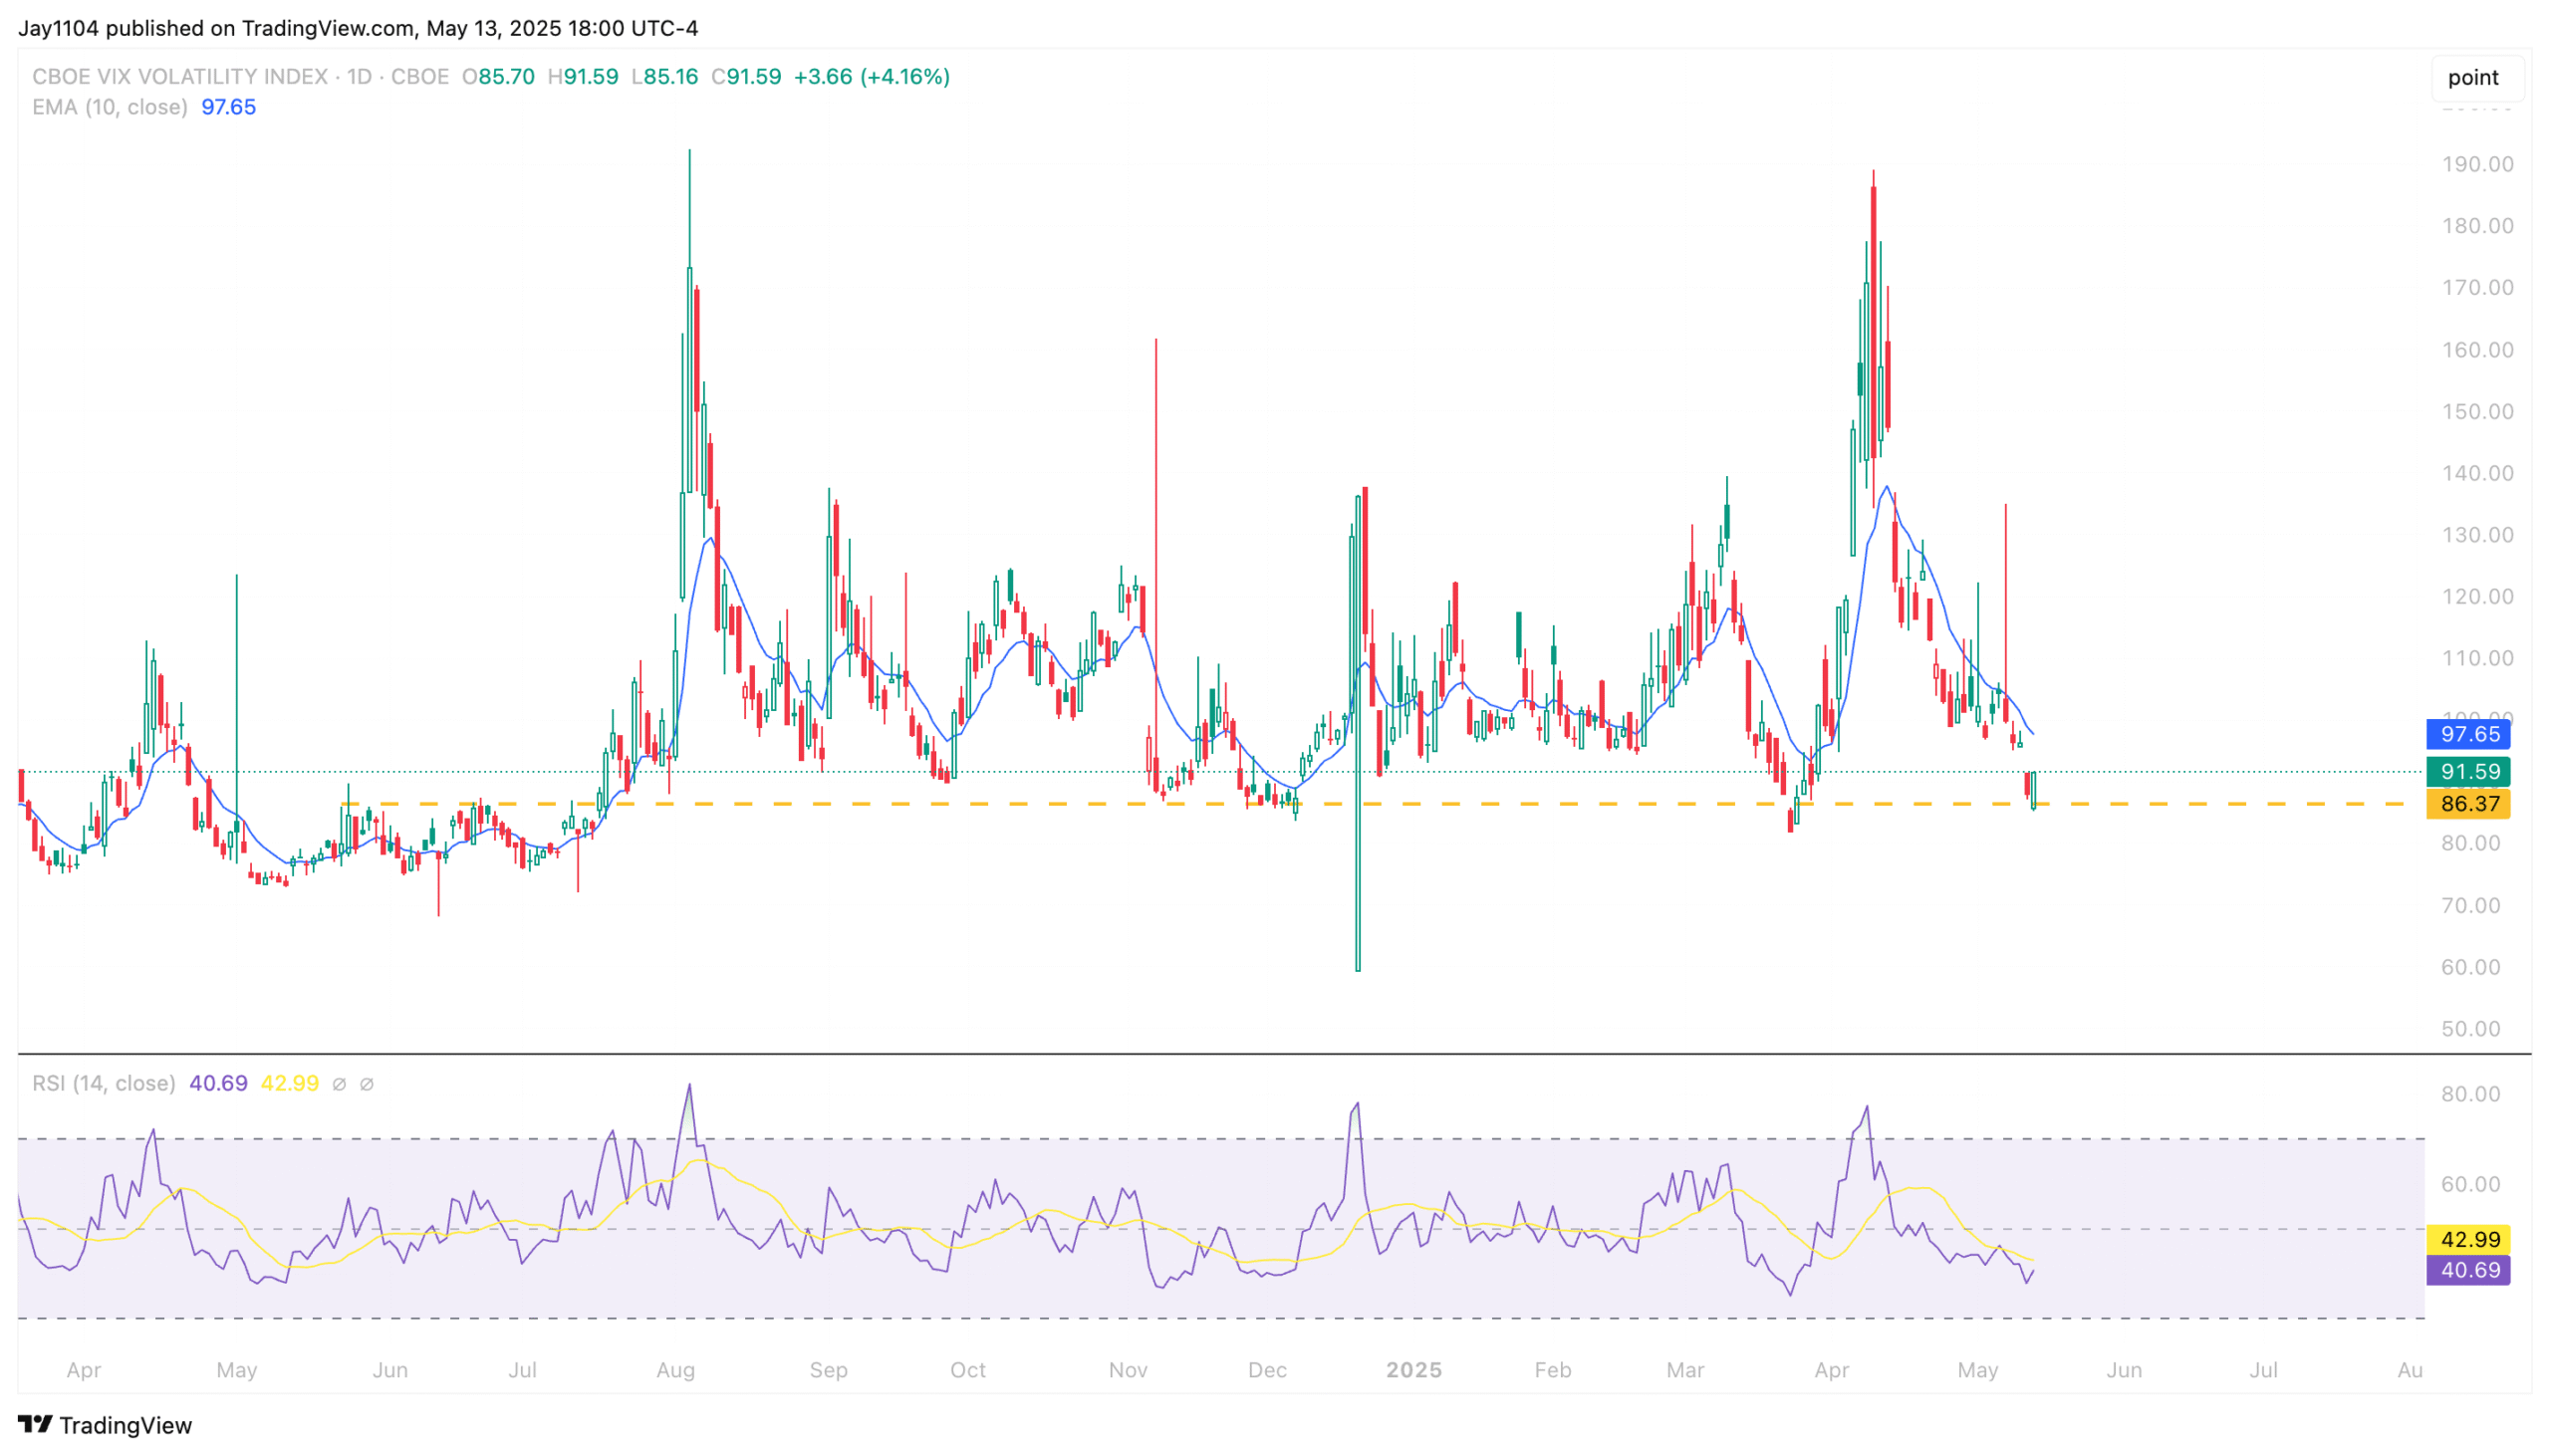
It is also worth pointing out that the
VVIX
traded higher yesterday. That is important because if the VVIX continues to move higher, the
VIX
tends to follow. We can see that the IV has been completely reset for the most part.
The
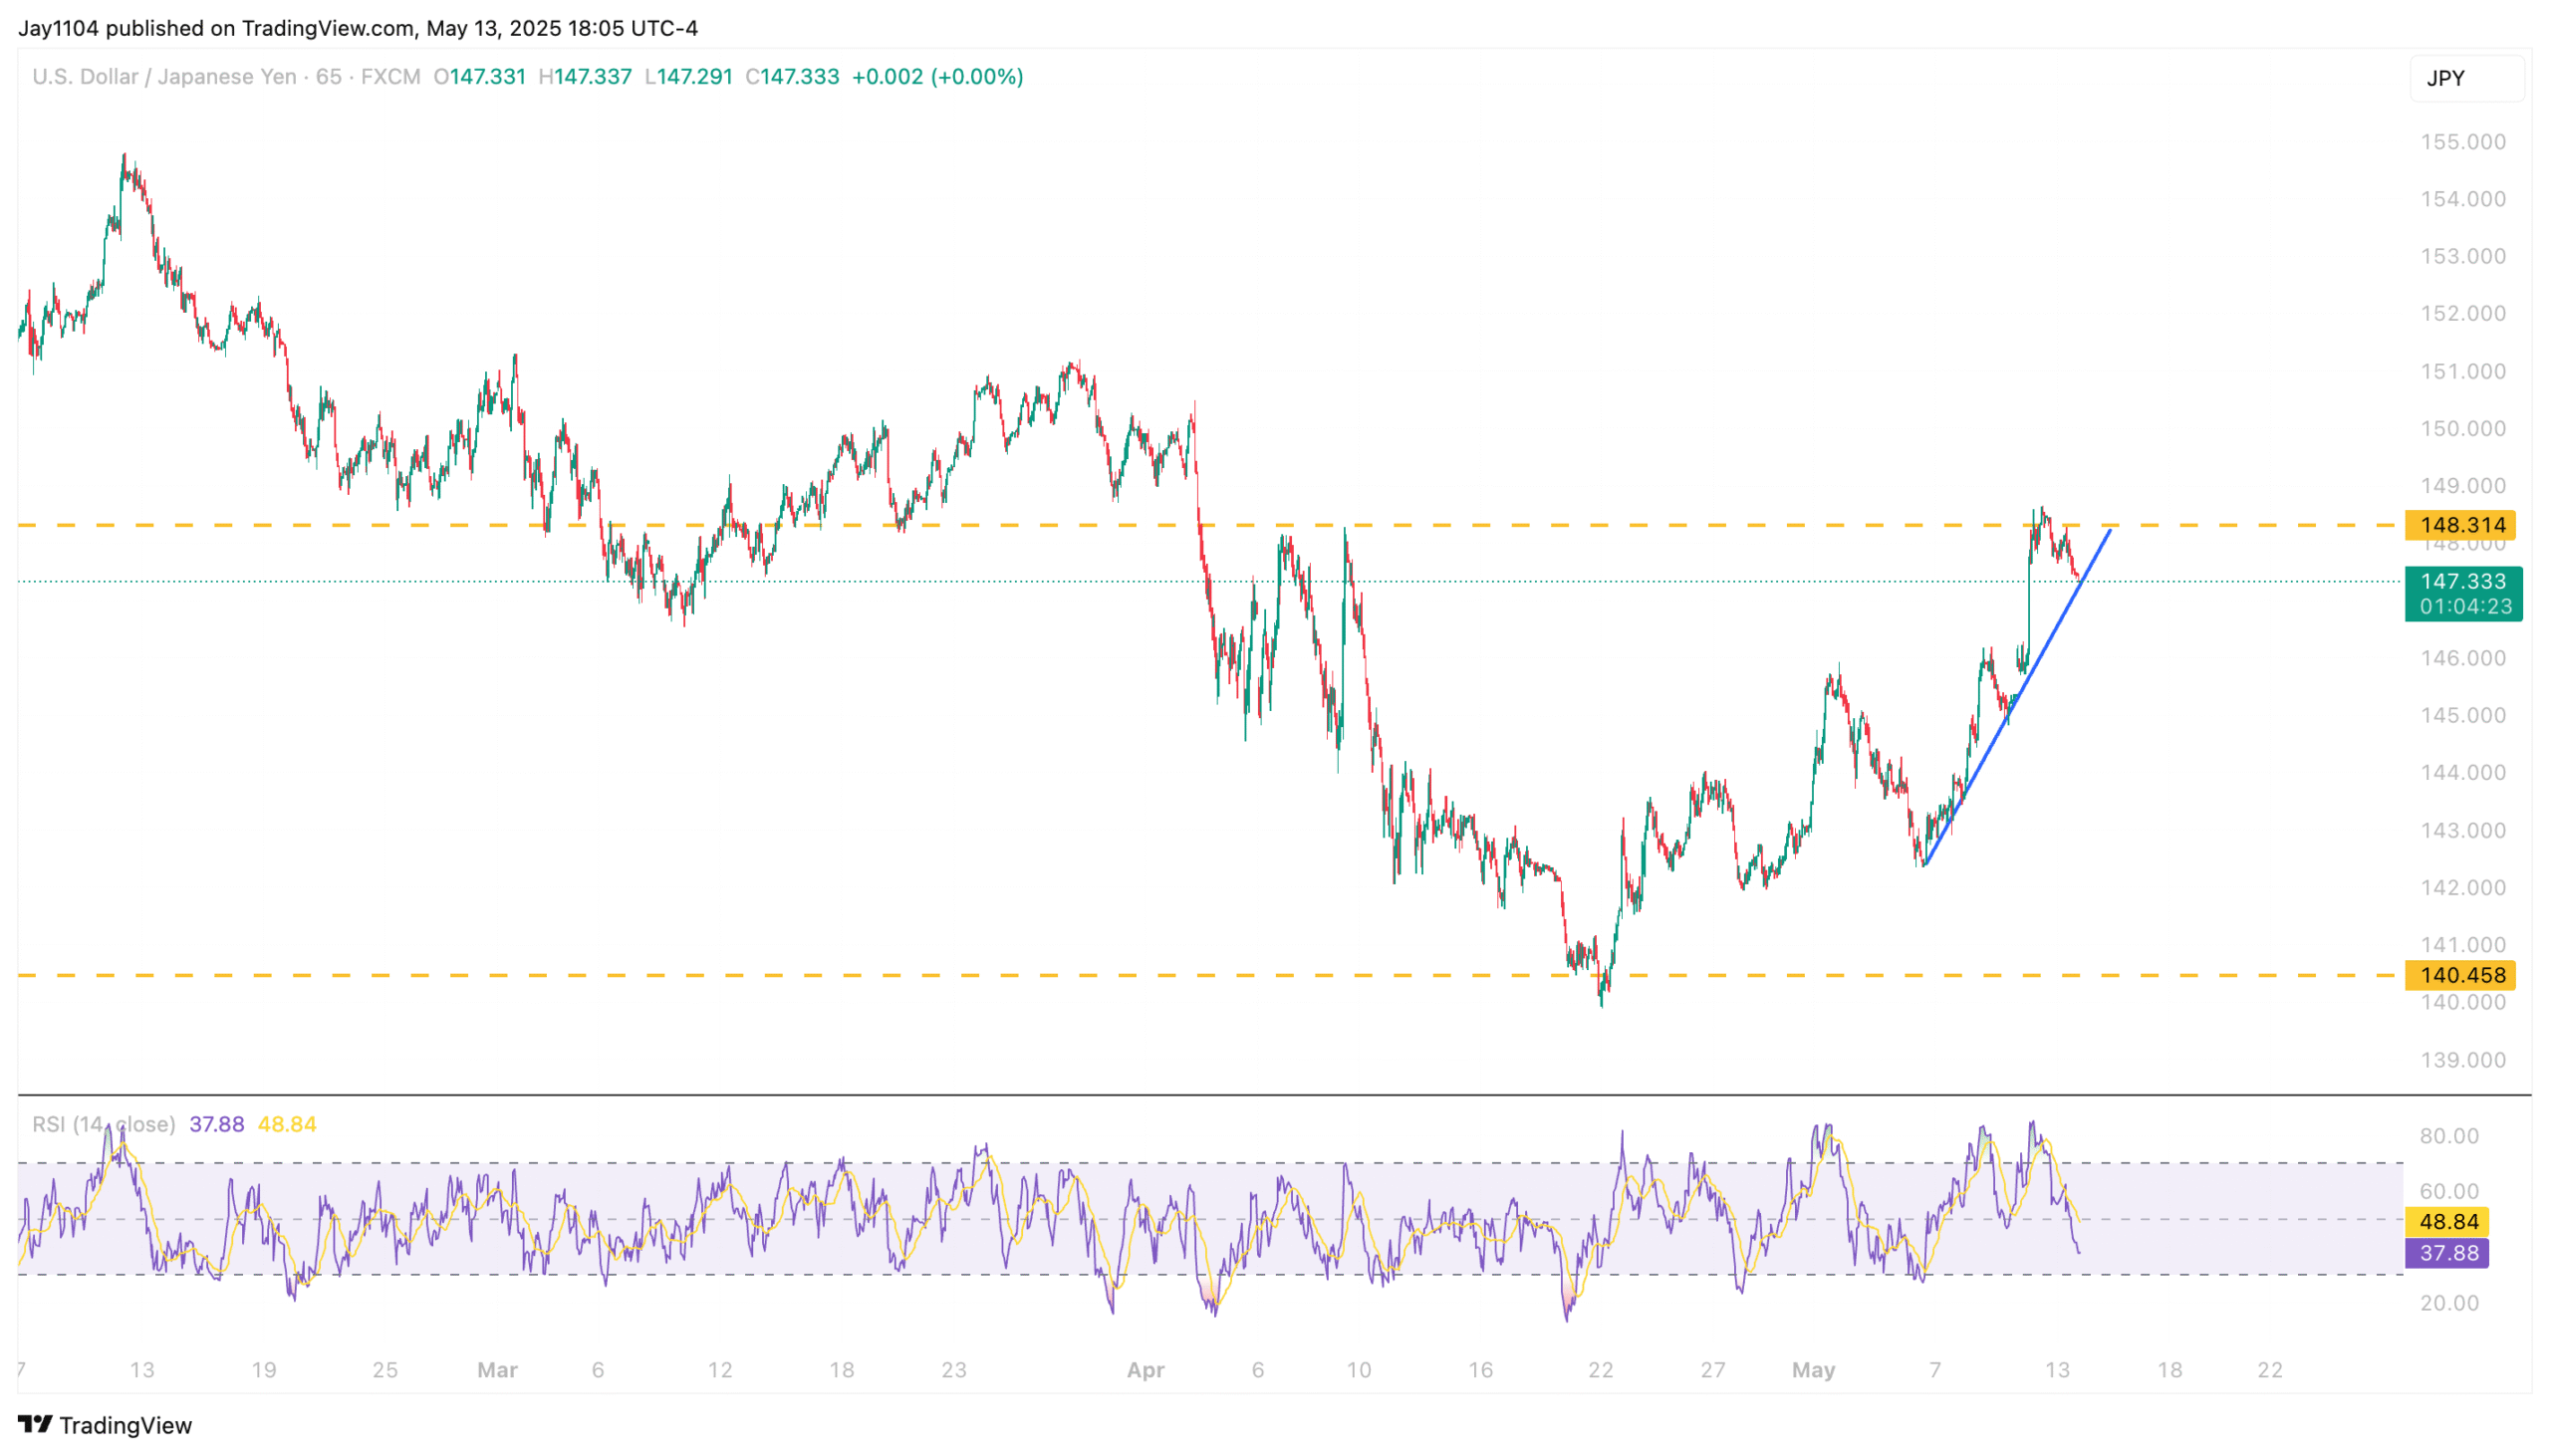
US dollar
was weaker yesterday than almost everything, with the
USD/JPY
moving lower back below 148. The USD/JPY is on the trend line, and breaking that trend will probably lead to the USD/JPY strengthening back into the 145s.
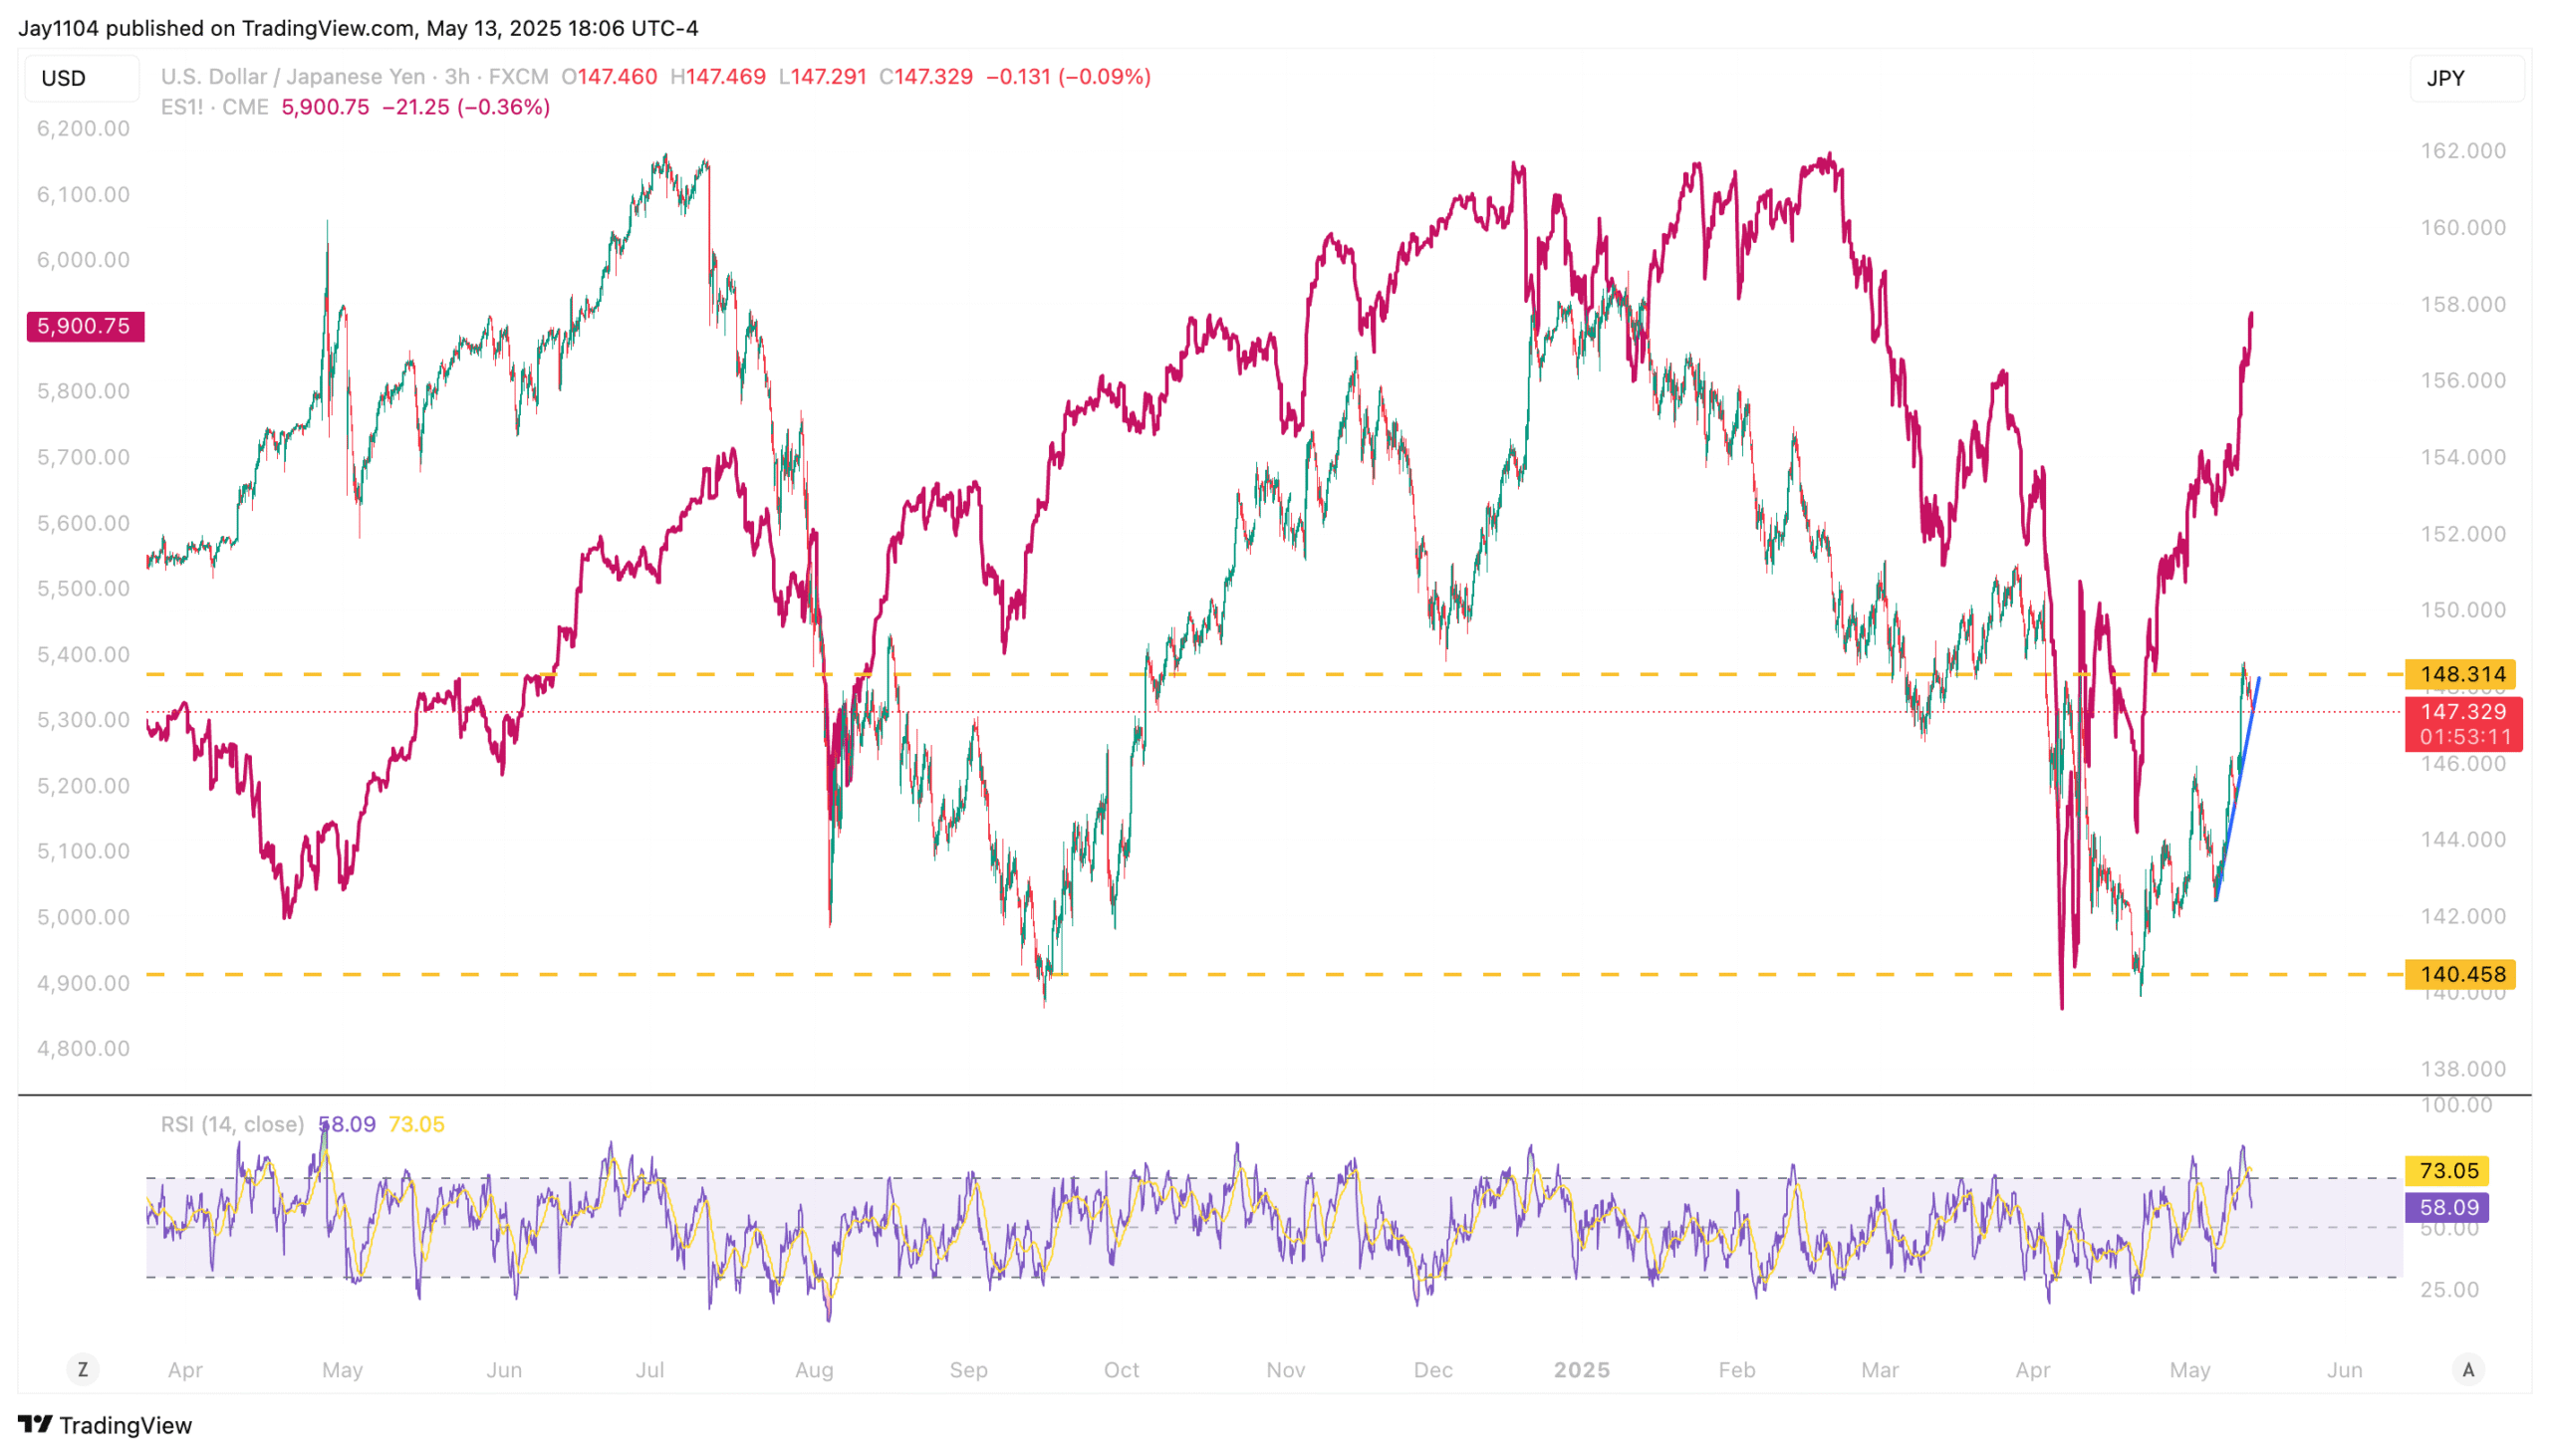
For the most part, the S&P 500 and the USD/JPY have moved together. Perhaps they are due to separate and decouple. It is possible, but close attention will still be needed.
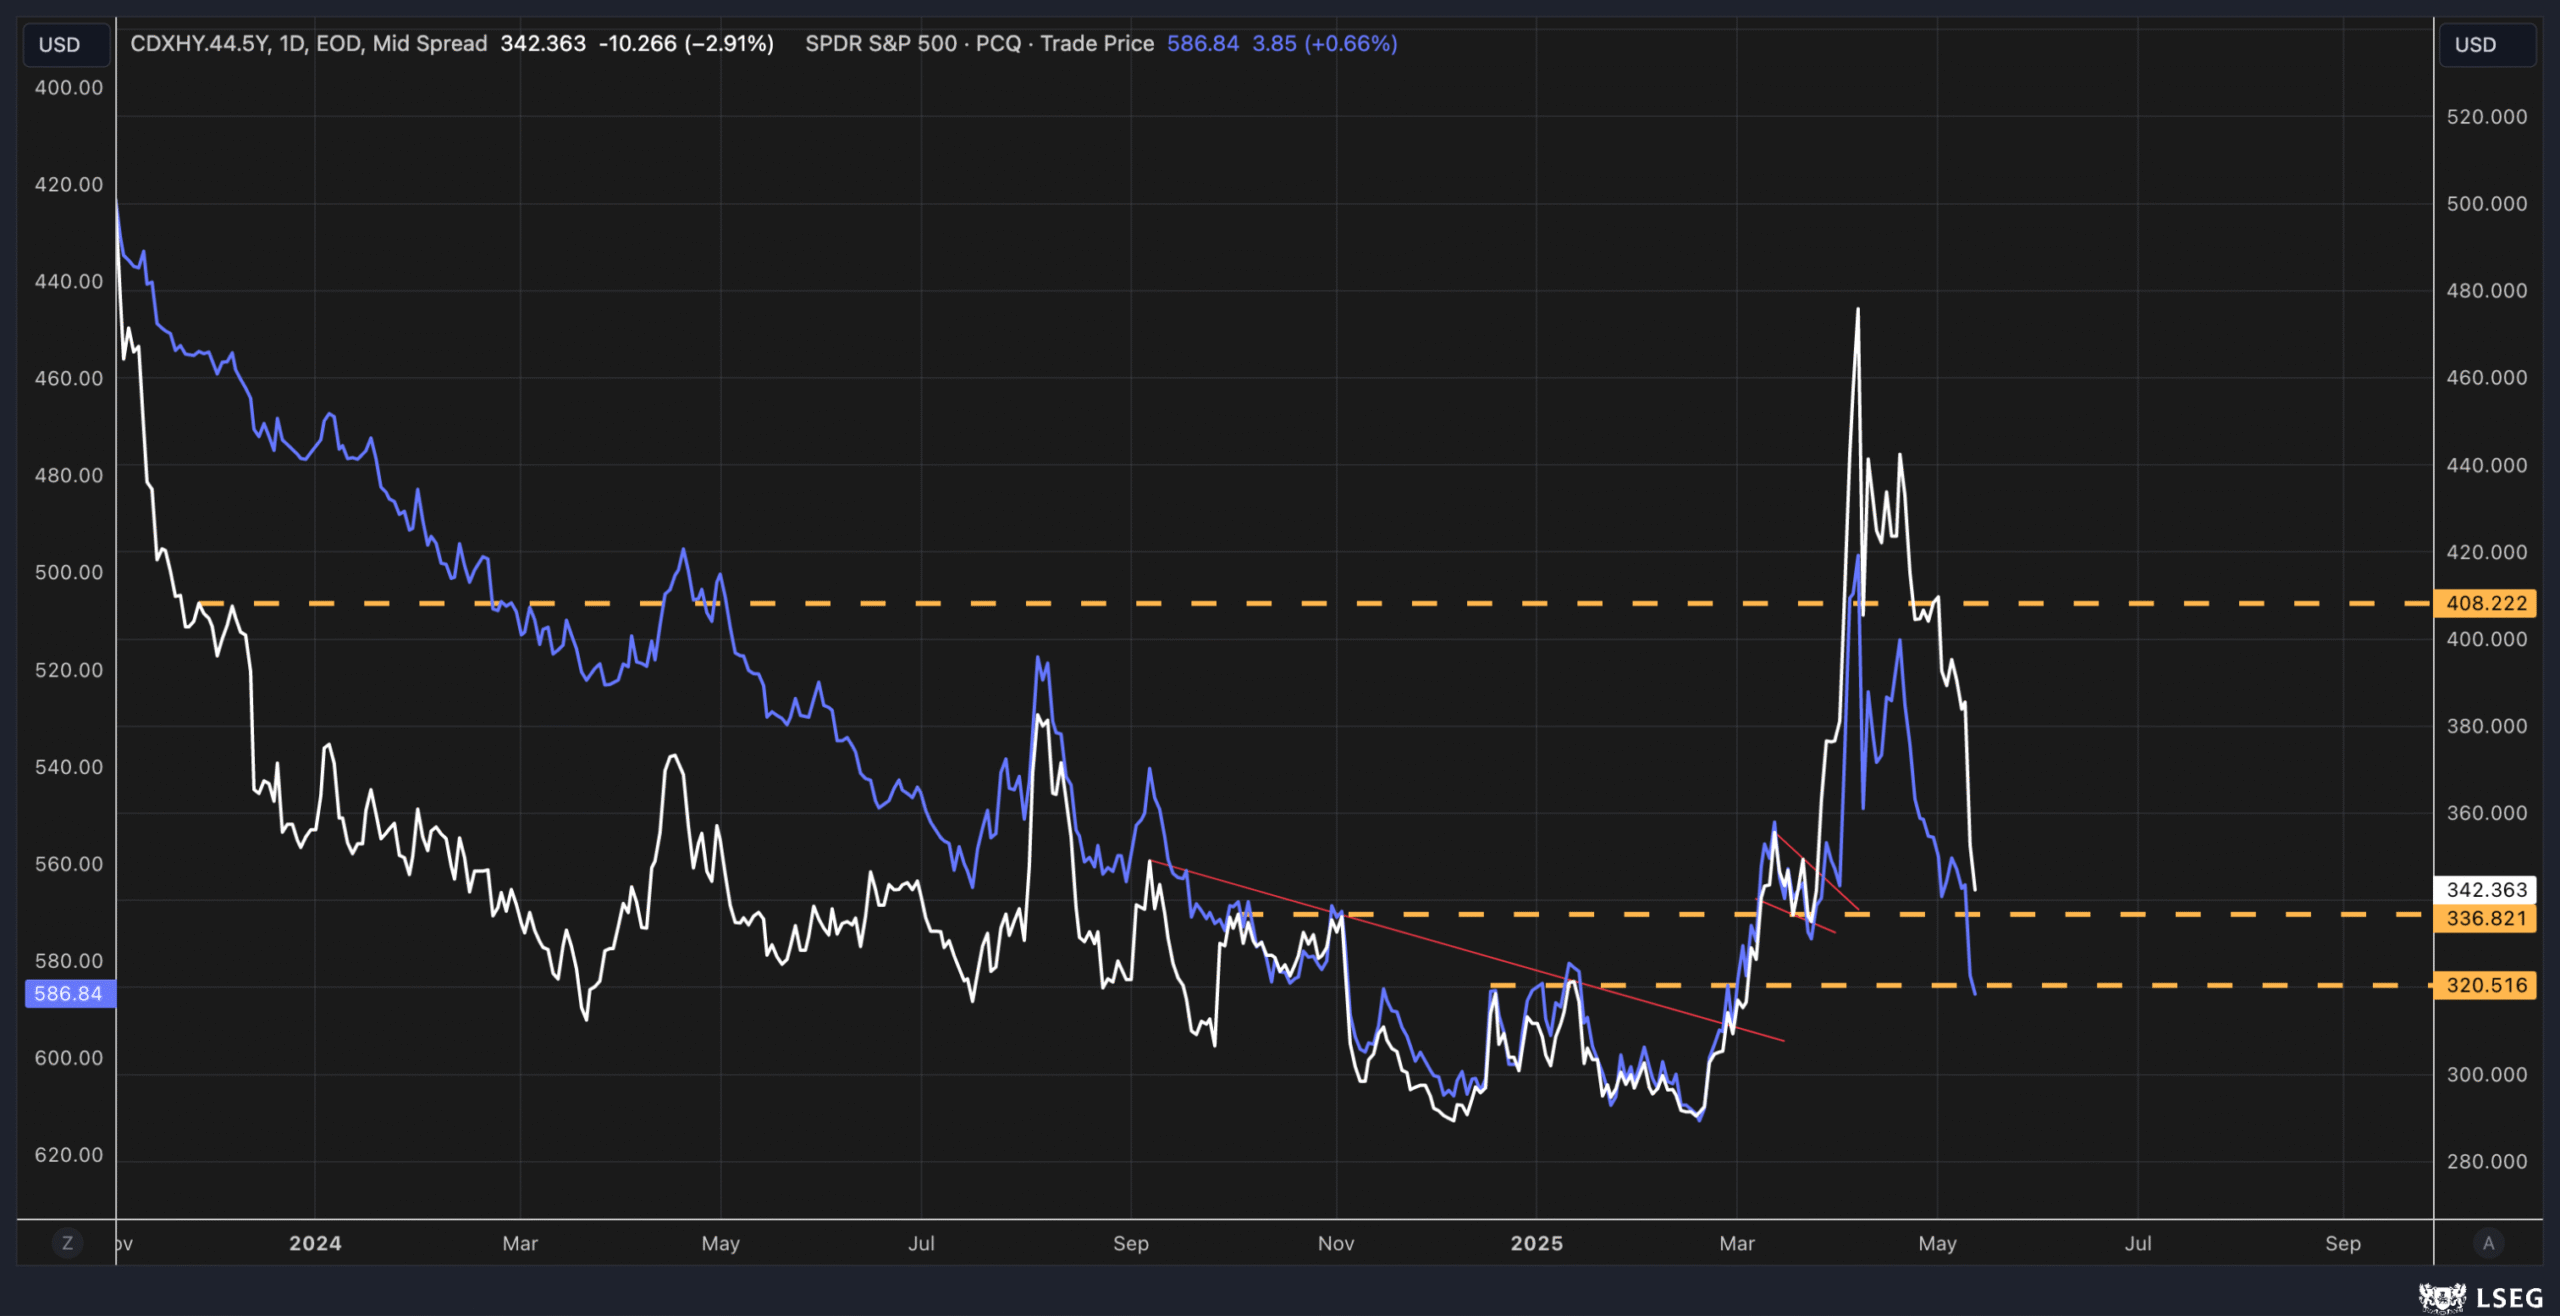
We have also seen credit spreads tighten, but those are still above the breakout level of 336. We know that stocks trade with spreads.
With that said…
Original Post
