Key Takeaways
Boeing ( BA ) shares closed slightly lower on Tuesday to put an end to a five-day winning streak during which the stock gained 14%.
The stock got a boost to start the week after analysts at Berstein upgraded the stock , pointing out that the jet maker’s narrower-than-expected first quarter loss posted last week indicates a turnaround toward growth. In addition, Spirit AeroSystems Holdings and Boeing rival Airbus agreed to a deal Monday, clearing the way for Boeing to reacquire the supplier as it works to improve its manufacturing quality
Boeing shares have gained 5% since the start of the year, after a turbulent 2024 that saw the stock lose a third of its value as a string of production mishaps and a crippling machinists strike weighed on investor sentiment. Boeing shares fell 0.2% to $182 on Tuesday.
Below, we break down the technicals on Boeing’s weekly chart and identify major price level worth putting on the radar.
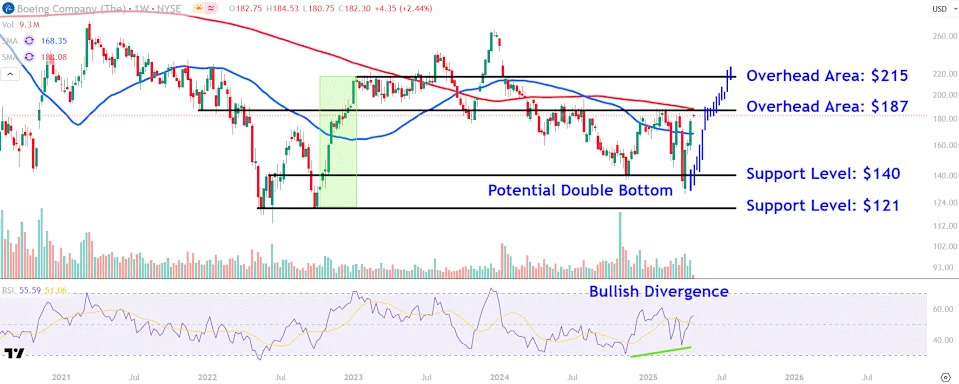
Double Bottom Takes Shape
Since forming a bullish piercing pattern earlier this month, Boeing shares have continued to move higher, potentially forming a double bottom in the process.
It’s also worth noting that while this month’s low made a lower low, the relative strength index (RSI) made a comparatively shallower trough to create a bullish divergence , a technical occurrence pointing to weakening selling pressure.
Let’s identify two major overhead areas on Boeing’s chart that investors may be watching and also locate important support levels worth tracking during pullbacks .
Major Overhead Areas to Watch
The first overhead area to watch sits around $187. This level may provide resistance near the closely watched 200-week moving average and a horizontal line that connects a range of trading activity on the chart stretching back to late 2021.
Further buying enthusiasm could lift Boeing shares to the $215 level. Investors looking for profit-taking opportunities may decide to place sell orders near the upper range of a period of sideways drift on the chart between January and July 2023.
This location also sits in the neighborhood of a projected bars pattern target that takes the stock’s steep uptrend following a prior double bottom on the chart and repositions it from this month’s low, providing insight as to how a similar move higher may play out.
Important Support Levels to Track
A retracement in the stock could see the shares fall to around $140. This area on the chart would likely attract buying interest near last November’s prominent swing low , which also closely aligns with a brief period of consolidation in mid-2022.
Finally, a further descent in Boeing shares could see a drop to lower support at $121. Investors may view this as a potential buying level near the May and September 2022 swing lows that preceded the stock’s steep move higher in the fourth quarter of that year.
The comments, opinions, and analyses expressed on Investopedia are for informational purposes only. Read our warranty and liability disclaimer for more info.
As of the date this article was written, the author does not own any of the above securities.
Read the original article on Investopedia