Oof. It is crazy that in the year of our Lord 2025, the 2008 mortgage crackdown that has defined housing and the economy for 17 years and counting is almost completely unacknowledged.
Abundance vs. the Progressive Left
I tried and tried to get the ear of Ezra Klein, and failed. He and Derek Thompson have an important new book out called “Abundance”. The problem of urban land use obstructions is an important element of it. They are getting push-back from the progressive left, who tend to want to attribute bad outcomes to the market power of corporations.
Part of that pushback involves re-litigating the 2008 financial crisis. And Klein and Thompson don’t have a good response because they don’t know about the mortgage crackdown.
Understanding the scale and the consequences of the mortgage crackdown would greatly strengthen their argument. The American Prospect’s David Dayen challenged Thompson:
In 2006, over 2 million units of housing were built, and after that we entered the biggest depression in modern homebuilding history. Single-family homes didn’t rebound in construction for more than a decade, and multifamily, which wasn’t really involved in the bubble, didn’t recover for five years.
I know you don’t believe that there were no zoning rules in 2006, and after 2006 there was a swarm of them. What happened was we had a housing bubble collapse, brought on by deregulating housing finance… Hundreds of thousands of construction workers lost jobs; thousands of construction businesses went bankrupt. It was a deeply scarring event.
He blames the collapse in construction on the preceding lending boom and the persistence of it on a cartel among home builders.
Both, of course, were caused by wiping out at least 1/3 of mortgage access that had long been established by post-New Deal federal mortgage programs. Klein and Thompson don’t appreciate that, so they have no answer for this. They don’t know the true answer, and none of the replacement answers that have filled the rhetorical gaps for 17 years are compelling.
I don’t blame them for this. The academy has failed them. I just wish I could help them understand. They have a stronger argument. They just need to see the elephant.
Glaeser and Gyourko
Ironically, given Dayen’s comments, here come along the leading academics on the urban zoning problem, also stretching themselves around the elephant in the room to say, wait, maybe it was zoning that changed after 2006.
In the abstract of a new paper, Edward Glaeser and Joseph Gyourko write, “New housing growth rates have decreased and converged across these and many other metros, and prices have risen most where new supply has fallen the most.”
Yeah. Existing low tier homes were too cheap for most of the last 17 years because likely near 20 million families were suddenly locked out of mortgage markets, so housing supply became similarly inelastic in every city from Kalamazoo to Phoenix. Glaeser and Gyourko, somehow seeming to be completely unaware of this , follow up with this doozy of a non-sequitur.
“A model illustrates that structural estimation of long-term supply elasticity is difficult because variables that make places more attractive are likely to change neighborhood composition, which itself is likely to influence permitting.”
The problem with being creative and really, really smart is that you can always come up with a theory to replace the elephant.
That wouldn’t be a problem if anyone, like a single person, who would be involved in the vetting, editing, and research of a paper like this were even just a little bit aware of the most devastating policy change of a generation.
Excess rent inflation has accumulated 28% since 2015 in Kalamazoo, following the permanent collapse of 2/3 of its local construction market. Dayen blames housing cartels. Klein and Thompson shrug. Glaeser and Gyourko add the possibility that maybe Kalamazoo became more attractive and changed its neighborhood composition, which influenced permitting.
That elephant is really making things uncomfortable in here.
I will give kudos to Glaeser and Gyourko for unapologetically citing 15 million units as the possible scale of the missing supply.
That gap is all in single-family homes, relative to pre-2008 trends, because the gap was caused by the mortgage crackdown. Glaeser and Gyourko notice that the decline in construction was mainly “in moderate- to high-price, low density and typically suburban census tracts”. That’s because when apartment construction had recovered back to pre-2008 levels in 2014, single-family construction was still down more than 60%, because of the mortgage crackdown.
Every city is a Superstar
They analyze 6 metro areas. They write:
Throughout the nearly three-quarter century time period we cover, Detroit and Los Angeles have remained at the bottom of the pack in terms of net housing unit production... Of course, as our data on housing prices show, Detroit’s weak growth reflects limited demand, while Los Angeles’ low growth reflects limited supply.
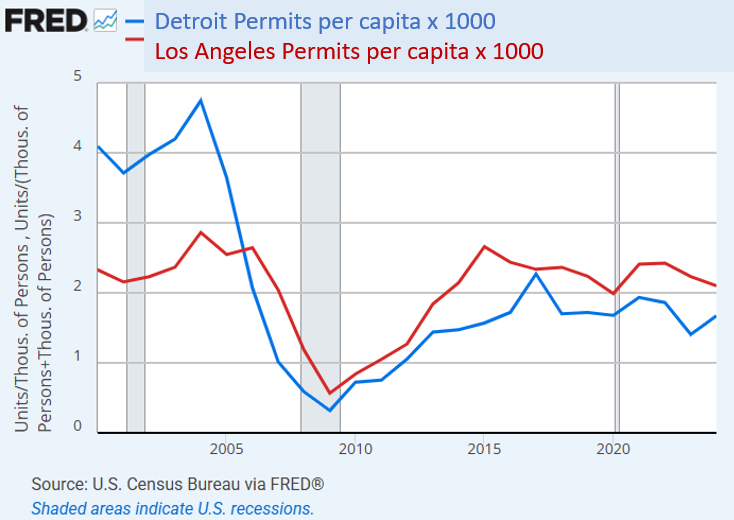
Home price trends in Detroit and Los Angeles are freakishly similar since the mortgage crackdown. Cumulative population growth is also about the same since the crackdown.
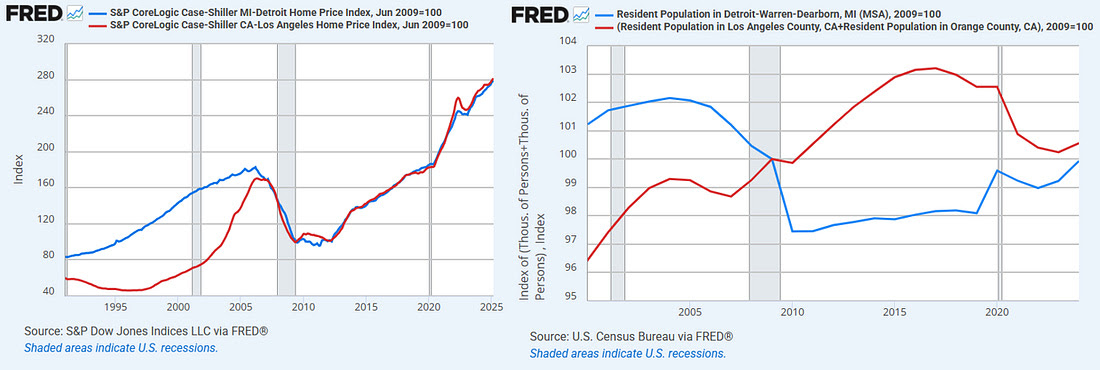
The mortgage crackdown has moved Detroit construction rates down to levels similar to Los Angeles. That is not high enough to simply maintain a stock of homes for a stable population.
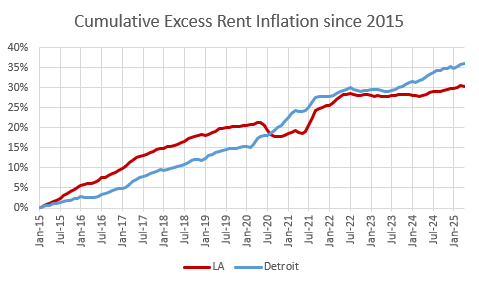
So, home prices in both Detroit and Los Angeles are similarly driven by regressively rising rents. Poor families must eat perennial rent inflation in order not to be displaced. Where the housing stock can’t keep up with baseline household formation, many families have to give up all income gains just to try to stay in place.
Why?
Because there aren’t enough homes, and families will pay whatever it takes to hold on to the last of what they have. This used to be the case only in “superstars” like Los Angeles. Now it is the case across the country. Housing markets now reflect the willingness of the marginal family to pay for the last of what they have before surrendering to regional displacement or homelessness.
What determines rent inflation at the lower margins of a city’s population is basically the answer to the demand “What do you have left to give?”
In their struggle to squeeze around the elephant while they wrestle with the facts they have, they note that the densest parts near the city centers of the cities they review have continued to become more dense while the less dense areas have stopped densifying. They then test the trends against price.
The Mortgage Crackdown, Single-Family Homes, and Apartments
They find that in the mid-20th century, parts of cities that were more popular and valued were more expensive. They tended to densify more as new residents were motivated to move there. But this has gradually changed over time. Since 2010, there has been little correlation between local prices and new housing.
They interpret this to mean that more affluent suburban residents have gotten better at blocking new housing at the very local level.
This is interesting, and as with so many housing findings, it is likely true to an extent over time, but its importance in inflating current housing costs is easily exaggerated as long as the elephant in the room is unnoticed.
The recent lack of correlation between high priced neighborhoods and construction of new housing is surely largely caused by post-2010 construction of single-family homes collapsing because of the mortgage crackdown.
Census tracts that were zoned for apartments suddenly had a much larger portion of construction after the mortgage crackdown. Apartments are usually located within a metro area where average home values and incomes are lower.
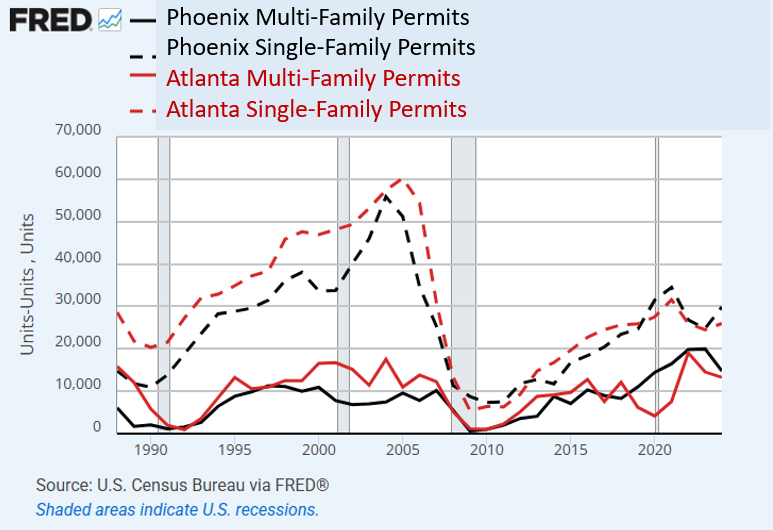
Over the longer term, I think they may have a case, but in the post 2010 period, I think they are too enamored with their thesis. They conclude, “We interpret these results as suggesting that building everywhere has become more difficult, but the change is most dramatic in the pricier suburbs.” Here, they analyzed Atlanta, Dallas, Detroit, Los Angeles, Miami, and Phoenix.
They made 4 bins by density and price, and they summed up the number of new units in each bin every decade since the 1970s. (High density and high prices, high density and low prices, low density and high prices, and low density and low prices)
Adding up all the units from these 6 metro areas, Figure 5 shows the percentage change in construction from the decade of the 2000s to the decade of the 2010s.
Low density construction declined by about 50% in both low-priced and high-priced neighborhoods, and actually declined slightly more in percentage terms in the low-priced neighborhoods. Building increased in high density neighborhoods both where prices were low and where prices were high. There was slightly more building in the lower priced dense neighborhoods.
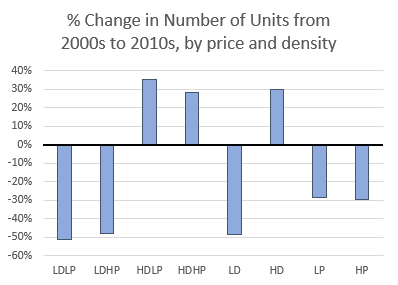
Looking at just density, low density construction declined about 50% and high density construction increased by about 30%. And looking at just prices, both low-priced and high-priced neighborhoods saw a decline of about 30%.
There could be a longer-term story about suburbs getting more aggressive about land use obstructions, but there is no reason to see the most recent decade as evidence of a downturn in construction in affluent suburbs. And, frankly, there is no reason to even entertain the hypothesis before the effects of the mortgage crackdown are controlled for.
There was less construction in low density neighborhoods because there were fewer single-family homes built. There were fewer single-family homes built because of the mortgage crackdown. That’s the story.
Data Doubts
There are a couple of data issues. Using the decadal dividing lines creates a problem for them. Again, they wouldn’t be likely to realize it would be a problem because the mortgage crackdown is entirely off their radar screen. They take a snapshot view of home prices at the decadal turn, but construction happens continuously over time.
Figure 6 shows the relative change in home price/income ratios over time for an Atlanta neighborhood that would have current average incomes of $180,000 and a neighborhood that would have current average incomes of $45,000.
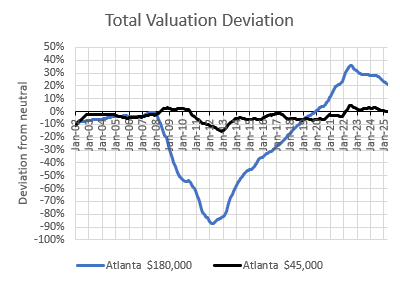
The sign of local regulatory supply obstructions is that land values get elevated. But the reason low tier single-family home construction collapsed after 2008 was that the mortgage crackdown caused prices to be too low . By 2020, relative prices had recovered.
So this massive price disequilibrium that had a huge effect on construction trends mostly happened and then reversed within the decade. (Of course, it took massive excess rent inflation in the low tier neighborhoods for the reversal to happen.) But, by 2020, Covid supply chain constraints created new supply constraints.
Again, as far as I can tell, they know none of this. They do recognize that 15 million units are missing. I’m not sure they realize that most of the 15 million missing units, relative to pre-2008 trends, are single-family homes at low price points where the existing neighborhoods spent most of the decade well below the cost of construction.
Finally, there is one other odd problem in the paper. In the process of elimination of other hypotheses (except for the elephant), they write, “One possibility is that rising prices for the metropolitan area as whole reflect a highly constrained and desirable interior with high and increasing prices, and an unconstrained and far less attractive urban fringe with low prices that are tied closely to construction costs.”
To check that, they look at trends in home prices in high-priced tracts versus low-priced tracts, and they conclude, “Price growth has outpaced income growth generally, and especially so in more expensive tracts.”
If I follow their argument, since they conclude that high-priced homes have increased in price the most while new construction in the least dense tracts far from city centers has declined the most, they conclude that it is supply constraints in the suburbs that are binding, not constraints in dense neighborhoods with high amenities in expensive city centers.
They appear to be comparing the prices of homes in individual tracts to the average income of the entire metropolitan area to get their price/income numbers. I’m not sure how this creates the false signal it does, but it does.
Where supply is constrained, it systematically plays out in exactly the opposite way. The cheapest neighborhoods become more expensive, not the most expensive ones. This is clear, extreme, and systematic regardless of the dataset..
That pattern is the whole raison d’être for this substack newsletter. Again, it’s odd that they somehow managed to arrange data in such a way to come to such a conclusion. But, much more odd is that this apparently didn’t strike them as odd.
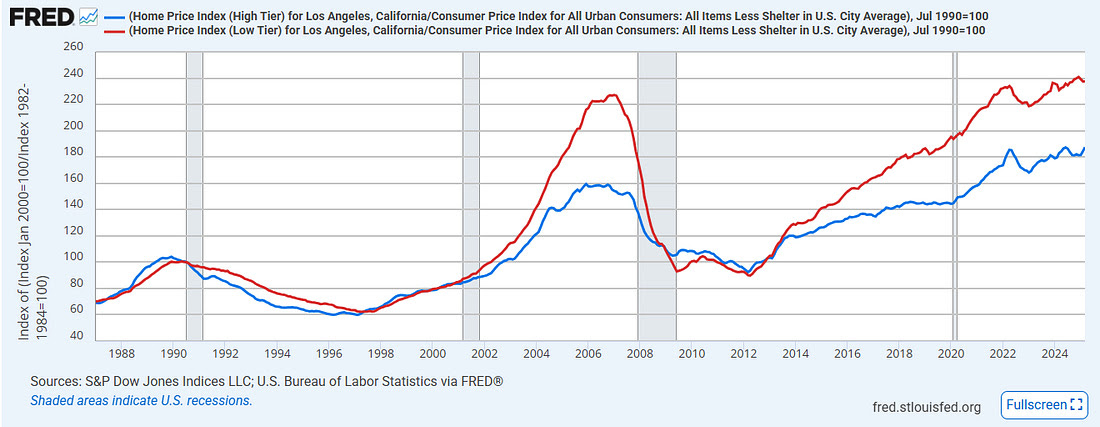
In Figure 6, you can see that this effect is so strong that it more than reversed the depressive effects of the mortgage crackdown in low-tier Atlanta. Figure 7 is the Case-Shiller index for low-tier and high-tier Los Angeles, adjusted for inflation. High-priced homes have definitely not appreciated more than low-priced homes in cities with inelastic supply conditions.
My substack and my papers might be a secret to most economists. These trends shouldn’t be.
Conclusion
In both the case of the Abundance proponents and Glaeser and Gyourko, they are generally on the right side of these issues. Their basic motivation for writing - that local political machinations have made it hard for Americans to provide for basic human needs - is important and true.
Highlighting and teaching about that problem will require learning about the mortgage problem.
It is a blind spot for these 4 authors. But the stunning thing - the absolutely unbelievable part of it - is that surely dozens upon dozens of prominent students, co-workers, peer reviewers, panel discussants and audience members, and editors have reviewed this work.
None of them , it appears, were aware of the most important economic event in housing markets in generations. It appears that not a single person thought to make a note for the authors, “Have you controlled for mortgage access, and its effect on single-family home prices and construction during this period?”
This is a failure of an entire field of study. How can we get from here to a place where we can accumulate knowledge again?
Original Post
