Market Overview: S&P 500 Emini Futures
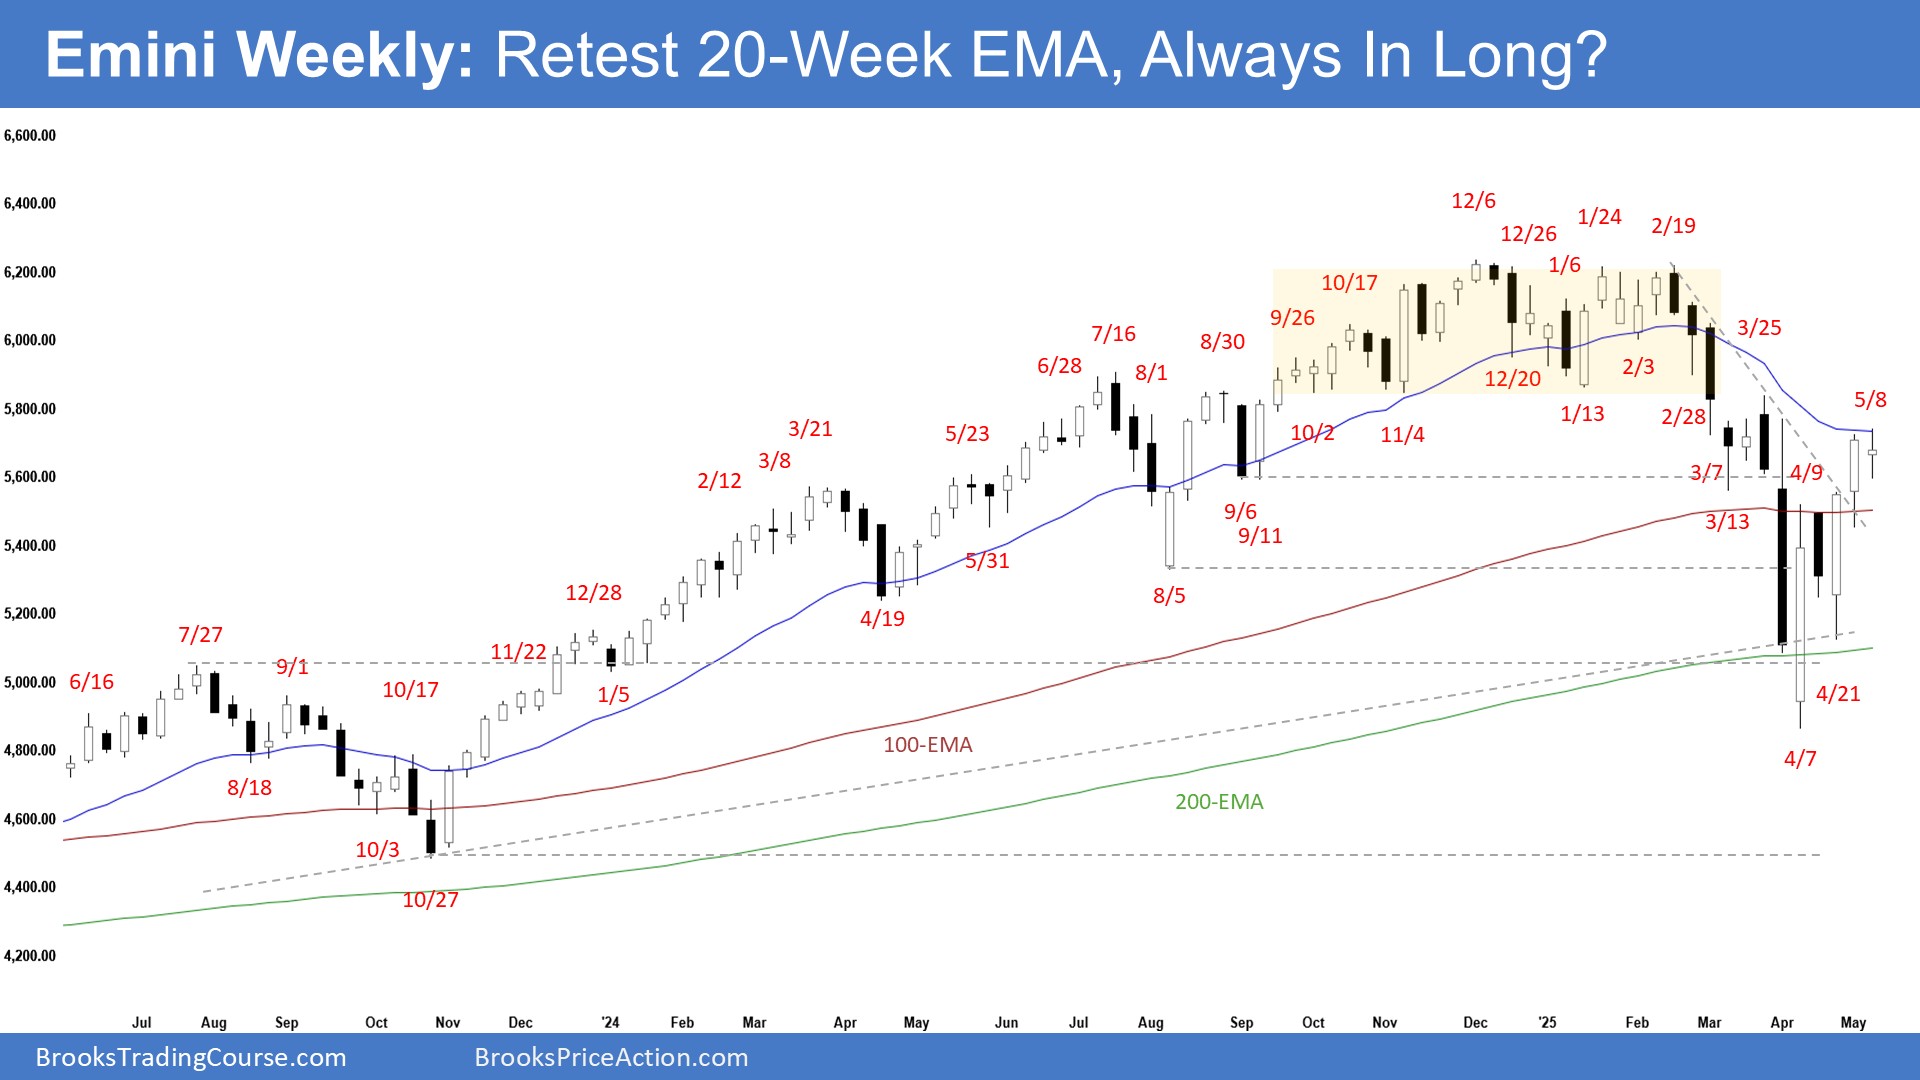
The S&P 500 Emini formed a weekly strong Emini pullback testing the 20-week EMA. If there is a pullback, the bulls want it to be minor, forming a double bottom bull flag (and a higher low) with the April 21 low. The bears They want the 20-week EMA or the March 25 high to act as resistance.
S&P 500 Emini Futures
The Weekly S&P 500 Emini Chart

- This week’s Emini candlestick was a bull doji closing around the middle of its range with long tails above and below.
- Last week, we said the market could still trade a little higher towards the March 25 high area. Traders would see if the bulls could create a follow-through bull bar closing above the 20-week EMA, or if the market would trade slightly higher but close with a long tail above or with a bear body instead.
- The market traded sideways for the week.
- The bulls got a two-legged pullback testing the 20-week EMA.
- They see the selloff (Apr 7) forming a major higher low and the market being in a broad bull channel.
- They hope that the strong selloff has alleviated the prior overbought condition. They want a resumption of the trend.
- They got a reversal from a higher low major trend reversal (Apr 21).
- If there is a pullback, they want it to be minor, forming a double bottom bull flag (and a higher low) with the April 21 low.
- They hope the market has flipped into Always In Long.
- They must create more follow-through buying trading above the 20-week EMA and the March 25 high to increase the odds of a trend resumption.
- The bears got a large 2-legged selloff testing the 200-week EMA.
- They see the current move as a deep pullback and a buy vacuum test of the March 25 high.
- They want a reversal from a large double top bear flag (Mar 25 and May 8).
- They hoped to get a retest of the prior leg’s extreme low (April 7), even if it only forms a higher low.
- They want the 20-week EMA or the March 25 high to act as resistance.
- So far, the buying pressure since the April 7 low has been stronger (strong bull bars closing near their highs) than the weaker selling pressure (bear bars with limited follow-through selling).
- The market is currently stalling around the 20-week EMA.
- The doji bar could indicate an area of temporary balance.
- If the market continues to stall around the current levels, we may see a pullback towards the April 21 low area.
- For now, traders will see if the bulls can create a more follow-through bull bar closing above the 20-week EMA.
- Or will the market stall around the 20-week EMA, followed by another leg down instead?
- News of the tariff talks with China can cause the market to have big gaps next week (in either direction).
The Daily S&P 500 Emini Chart

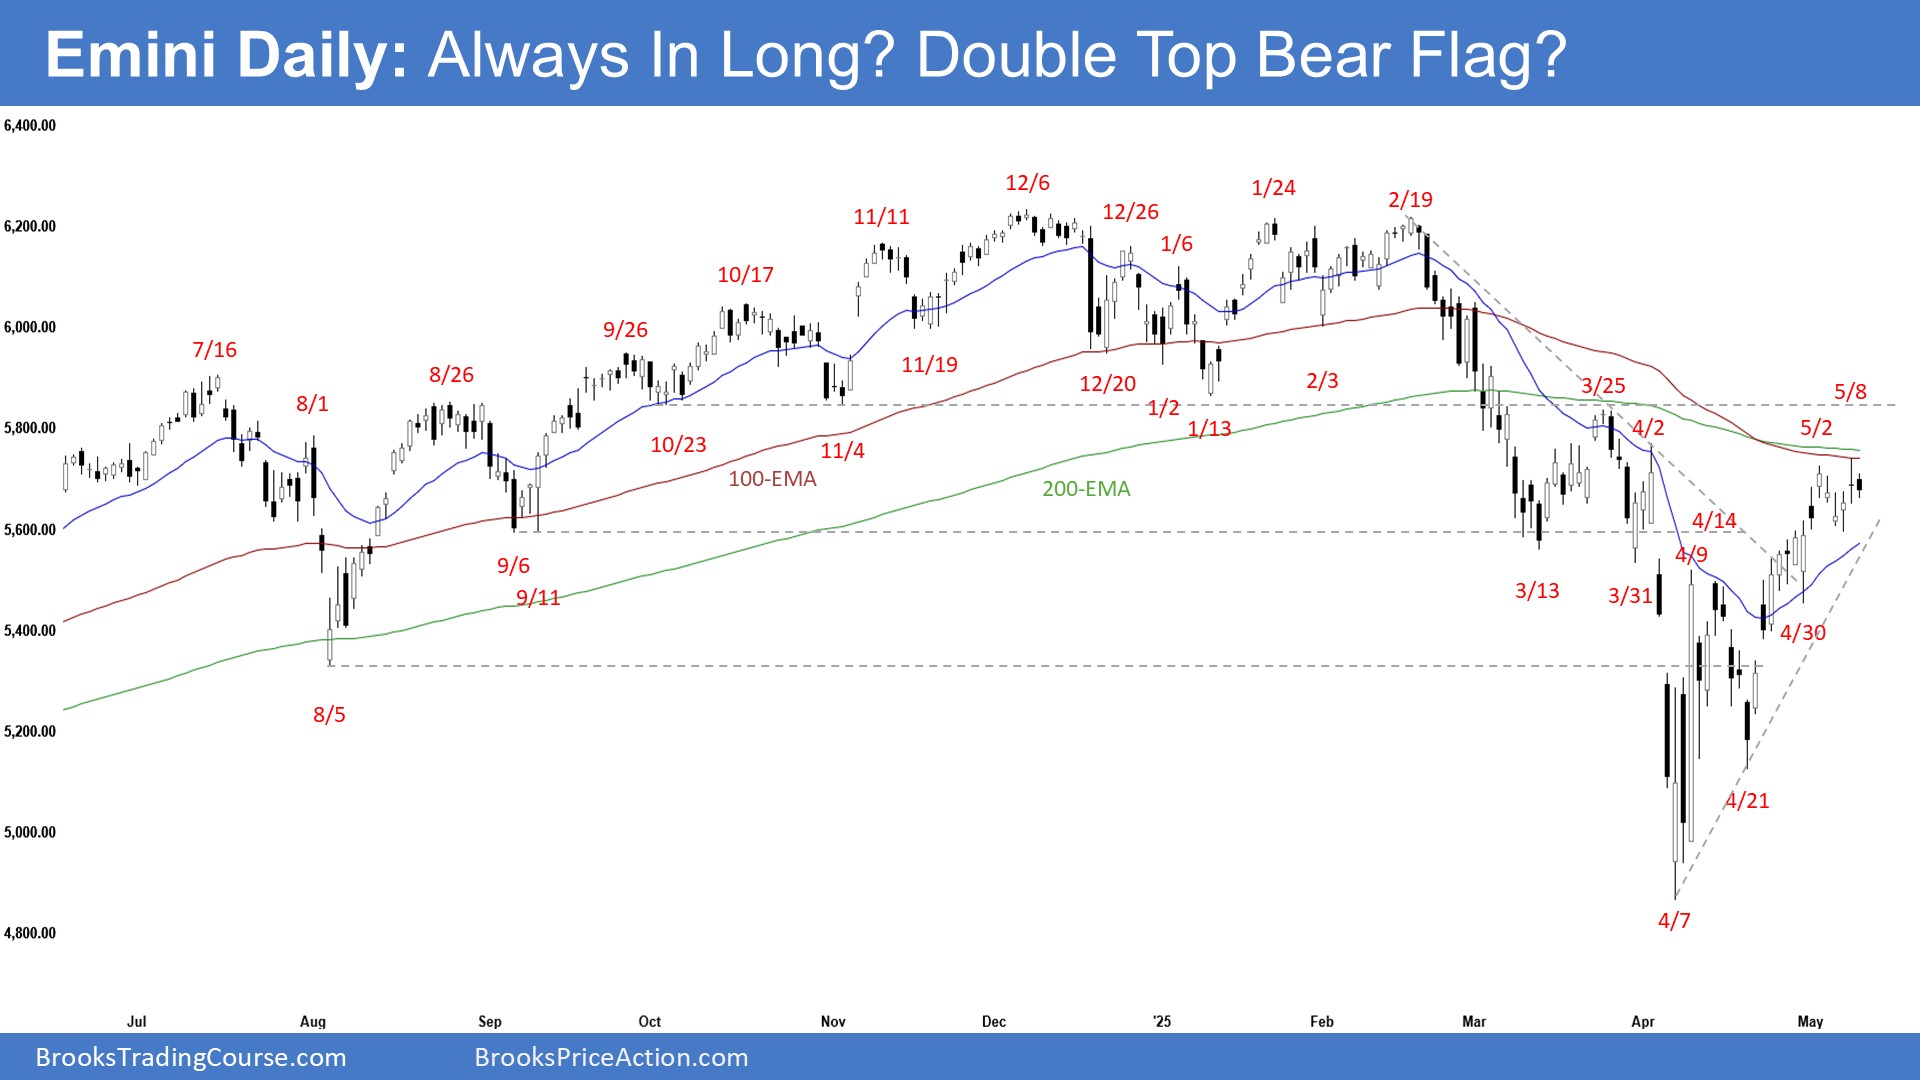
- The market traded sideways for the week. Thursday gapped higher but closed as a doji. Friday was an inside bear bar.
- Previously, we said the market may still be in the sideways to up pullback phase. Traders would see if the bulls could create more bull bars, breaking far above the 20-day EMA and the bear trend line or fail to do so.
- The bulls got a large second leg sideways to up testing near the 200-day EMA and the March 25 high.
- They see the market forming a major higher low (Apr 7) and want the broad bull channel to continue.
- They hope the selloff has alleviated the prior overbought condition and that the market has flipped back into Always In Long.
- If there is a pullback, they want it to form a double bottom bull flag (and a higher low) with the April 21 low.
- They want the 20-day EMA to act as support.
- The bears see the current move as a large 2-legged pullback.
- They want the market to form a lower high and a reversal from a double top bear flag (Mar 25 and May 8). They see a smaller double top (May 2 and May 8).
- They hope to get a retest of the April 7 low, even if it only forms a higher low.
- They must create strong bear bars to show they are back in control.
- So far, the buying pressure since the April 21 low is stronger (consecutive bull bars) than the weaker selling pressure (bear bars with no follow-through selling).
- The last 7 candlesticks had a lot of overlapping range, which indicates the market has temporarily stalled.
- Traders will see if the bulls can create more bull bars closing above the 200-day EMA and testing near the March 25 high.
- Or will the market stall around the current levels, followed by another leg down to test near the April 21 low instead?
- News of the tariff talks with China can cause the market to have big gaps next week (in either direction).
