Forget about looking for a “Trump Put.” There’s a much more reliable market ally in the White House.
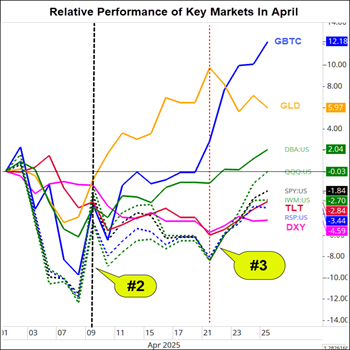
Last week, we experienced another volatile “Bessent Bounce.” Perhaps this one has the potential to be the confirmation of a reversal in bearish sentiment big enough to create at least an intermediate-term bottom in the U.S. equity markets.
However, as we covered in last week’s Market Outlook, the U.S. faces crisis-like conditions in the bond market, currency markets, and the equity markets.
As a result, last week’s rally in stocks is a welcome reprieve, but there are a few more market conditions that the bulls would like to see fall into place to create a solid foundation for a durable uptrend to persist. Most importantly…
- A healthy earnings season
- A calm resolution to the next big challenge for the markets - fending off a recession
Before addressing earnings season and the increasing urgency to fend off a recession, let’s first consider the expectations of a Bessent Bounce, which has not earned the credibility of a Fed Put.
The markets first demonstrated their respect for Mr. Bessent in late November when he was nominated for the Treasury Secretary position. Upon his nomination, the bond market rallied sharply, pulling stocks up with it. Investors had confidence in Bessent as a steady, experienced, and market-friendly choice that would balance Trump’s extravagant economic ambition with fiscal discipline and a more moderate approach to tariffs.
In the chart below, you can see the relative performance since the election of Gold ( GLD ), Bitcoin ( GBTC ), Bonds ( TLT ), the Dollar DXY ), commodities ( DBA ), and the equities (dotted lines) of SPY , QQQ , and IWM .
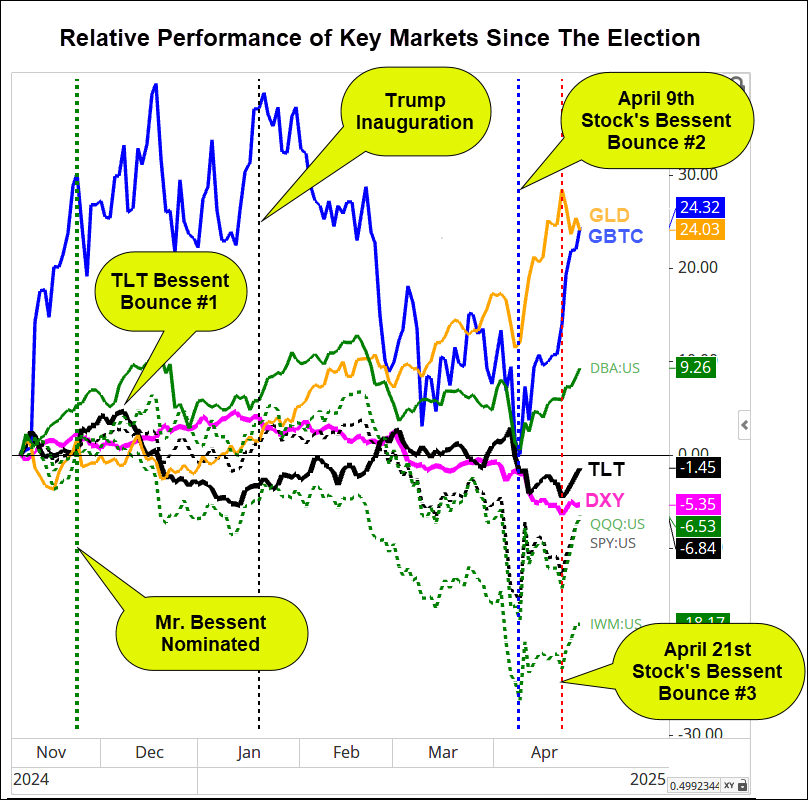
The initial Bessent Bounce (#1) pushed TLT up temporarily and supported equities for months. Unfortunately, Bessent’s nomination was not enough to turn the longer-term down trend in bonds, and they subsequently made new lows.
Another notable trend since the election has been the rally in gold and the decline in the Dollar . The Dollar initially reacted positively to the election as investors believed there would be stronger economic growth. However, as we explained in last week’s Market Outlook , the tariff policies that began after the inauguration reversed the demand for the dollar, accelerated the trend in higher in gold, and led to the need for another two “Bessent Bounces.”
The second Bessent Bounce (#2) came on April 9-10th. As U.S. stock and bond markets were falling sharply. Secretary Bessent was instrumental in persuading Trump to pause the implementation of widespread tariffs.
The rumors of a pause stopped the decline in markets, and the actual announcement of the pause in tariffs led to one of the largest single-day rallies in stocks. While this created a low in the stock market, it did not create a lasting rally.
Last Week’s Bessent Bounce (#3)
About two weeks later, last Monday, April 21st, stocks, bonds, and the Dollar were all down sharply as the Chinese trade war worsened with continued retaliation from China, and news broke that Trump was exploring whether he could lawfully fire Fed Chair Powell.
Comments by Bessent that suggested the trade war with China would soon de-escalate and talks would begin stemmed the market’s declines. These were followed by a comment by Trump stating that he did not intend to fire Chair Powell, which turned the market recovery into a substantial rally.
If you’ve been following our Market Outlook commentary, this sequence of events in the news, should sound like the pattern we’ve previously described as significant reversals that form when sentiment moves from very bearish to “less bad”.
As mentioned above, for a bounce to become a rally, there needs to be follow up developments which we’ll cover below, but first…
Has Bitcoin Established “Safe Haven” Status?
In last week’s Market Outlook , we focused on the “unintended consequences” of the execution of the administration’s trade policies, with one example being the “sell America” trade. This is the substantial desire by investors (domestic and foreign) to reduce exposure to U.S. stocks, bonds, and the Dollar.
To say Bitcoin has become the type of safe haven that investors have long viewed exists in the Dollar, U.S. Treasuries, and gold is premature, but it’s worth noting how Bitcoin responded to last week’s ramping up of the “sell America” environment.
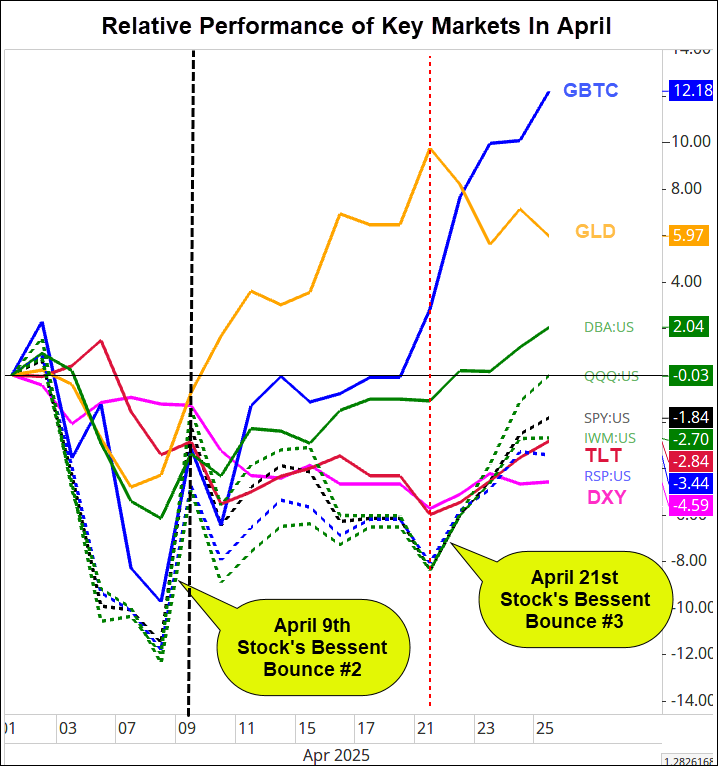
It’s most notable that in the days leading up to Monday’s Bessent Bounce #3 (when stocks bonds, and the Dollar were falling sharply) Bitcoin was rallying.
If the independence of the Fed was seriously threatened by something such as the White House taking steps to prematurely and forcefully remove the Fed Chair, would the markets run to Bitcoin?
Bitcoin has proven to be a ‘risk on’ asset with high correlations to the stock market. However, assets can have multiple personalities and change their correlations as market relationships adapt to new economic and geopolitical environments.
Consider the strength of Bitcoin (GBTC) in the chart below during the period between the vertical dotted lines, which is when the China trade war component of the “sell America” trade was cooling off, but the White House’s pressure on the Fed’s independence was being questioned and threatened in the eyes of the markets. Stocks (dotted lines), the Dollar (DXY), and bonds (TLT) were all falling, and the weakness was evident enough for the need for another Bessent Bounce (#3).
Gold Shows Its True Value AND Did You Know That Gold Has The Memory of an Elephant?
Gold is commonly considered to be a hedge against inflation, but I would suggest that you’re much better served by considering it to be a hedge against severe market uncertainty or instability. This may or may not be the result of inflation. There are plenty of cases of extended moves in gold that don’t relate to inflation.
The current environment does have a high level of inflation fear, but the core driver is more likely “uncertainty.” Note the acceleration in gold’s trend leading up to April 21st when the White House’s pressure on the Fed’s independence was being questioned and threatened in the eyes of the markets.
As demonstrated by the chart above covering markets’ performance since the election, gold has been on an extraordinary run, which can be most easily explained by the recently released chart by the IMF below.
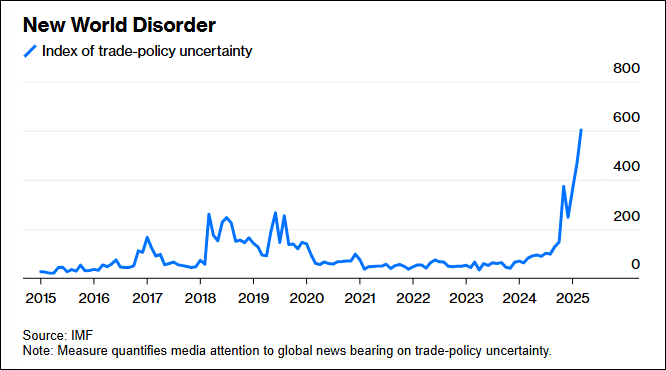
While this chart focuses on uncertainty in trade policy, a chart of domestic fiscal policy uncertainty would likely have the same pattern. The impacts of this are far more disruptive than just economic, as we’ve seen by geopolitical reactions by our allies.
When systems break down, be they pricing structures (inflation), geopolitical norms, domestic governance, foreign exchange, etc., markets move to safe haven assets which have traditionally been the US Dollar, Treasury Bonds, gold, Yen , Swiss Franc .
As you can see in the chart below, the traditional (non-US) safe havens have been working while the “sell America” plagues the U.S.
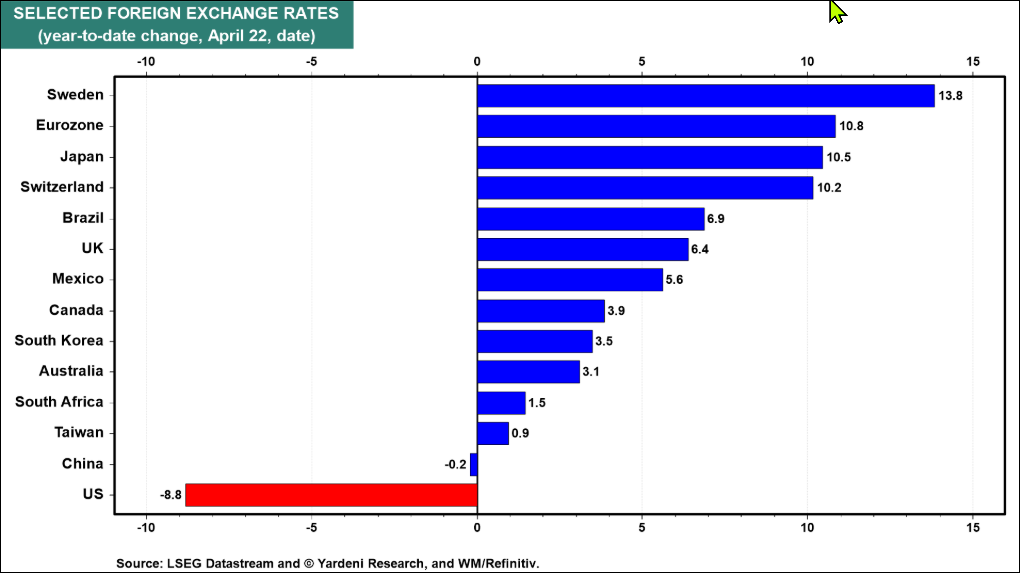
With the US shunned as a safe haven, gold has become even more attractive and has rallied 24% in 2025.
Gold’s short-term correlation to uncertainty was demonstrated by the fact that last week’s peak in gold not only corresponded with the Bessent-inspired relief.
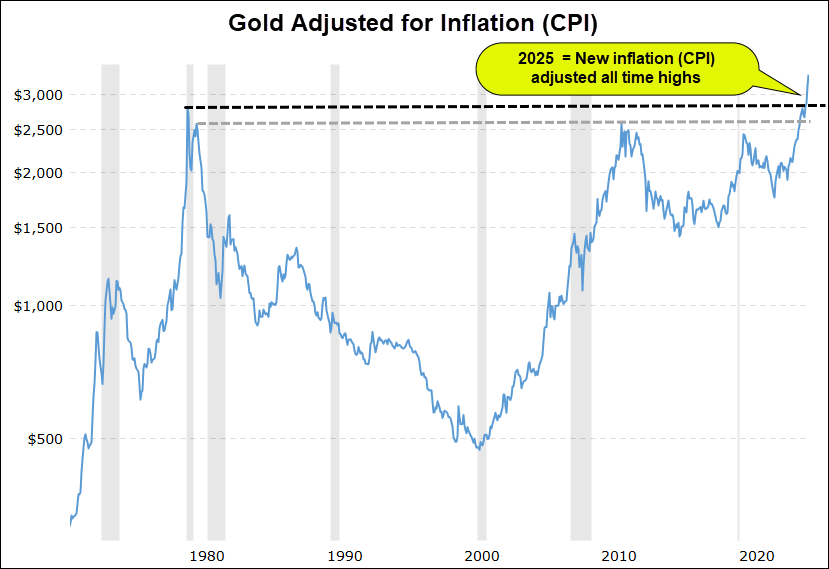
For better or worse, however, gold’s 15-year base below its long-forgotten all-time historical high in gold from 1980 has clearly been broken with technical precision!
As you can see in the chart below, gold stopped just shy of its all-time high at a prior high in 2011. Then, in late 2024 again, it tapped and retreated from its inflation-adjusted all-time highs, retracing to its prior 2011 high support.
Since January, it has breached and accelerated to new inflation-adjusted all-time highs.
With Strong Gold and “Sell America” Trends In Place, Why Believe In The 3 rd Bessent Bounce?
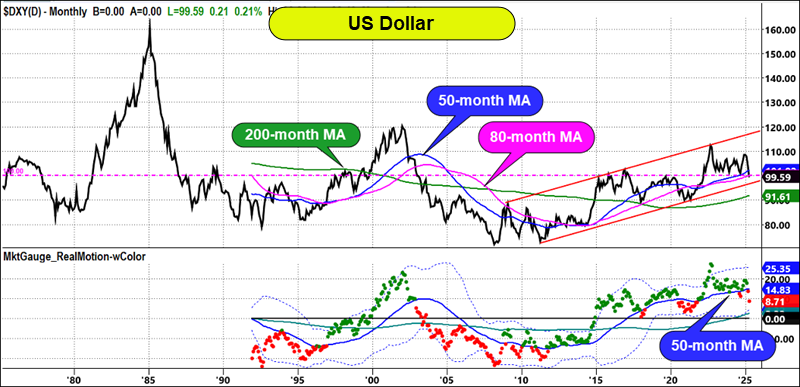
The Dollar may be indicative of undesirable “sell America” sentiment and not the safe haven we’ve enjoyed in the recent past, but a longer-term perspective shows that it’s also not historically weak.
The historical chart of the dollar below offers several perspectives worth considering:
- Since its bottom in the early 90’s, its range has been roughly 70 to 120 and it currently sits just above the middle of that at 100.
- The 200, 80, and 50-month moving averages have been good indicators of trend condition. It currently sits on both its 50 and 80-month averages in an uptrend from its 2010 low.
- On a cautionary note, the Real Motion indicator’s condition of being bearishly below its 50-month average suggests more dollar weakness ahead until Real Motion and the DXY trade back over their respective 50-month MA.
Last week, we pointed out the correlation between equities and currencies and this week Ed Yardeni suggested that a major contributor to the Dollar’s recent weakness could be foreigners dumping their Mag 7 stocks.
It certainly makes sense when you look Ed’s chart below and consider the current outperformance of foreign equity markets vs. the US, as you’ll see in Keith’s weekly video:
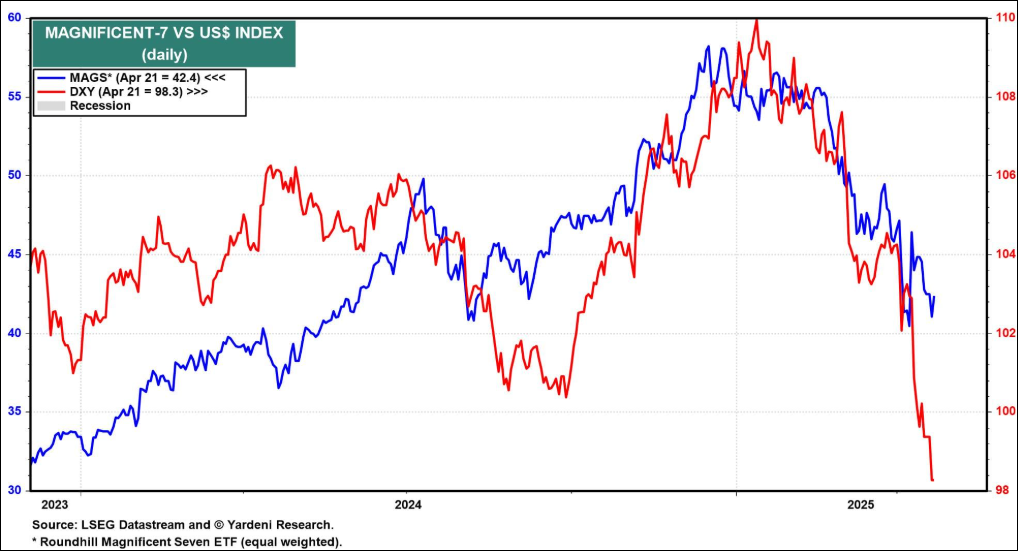
Unfortunately, foreign selling of US stocks isn’t the only thing that weighs on the dollar and is probably minor in size compared to the decline in demand for dollars that could result if Trump is successful in his trade policy goals.
Fortunately, there are benefits to a lower dollar, and they may provide a counterbalance to the stresses created by uncertainty and isolationist trade policies, as discussed below.
The Next Two Big Hurdles For The Market – Earnings & GDP Growth
In order for the Bessent Bounce #3 to turn into a longer-term bottom and continue as a durable bull rally, corporate profits and the economy are going to have to provide support.
Next week is the busiest week of the earnings season.
So far, earnings season has been satisfactory. According to Factset…
“36% of the companies in the
S&P 500
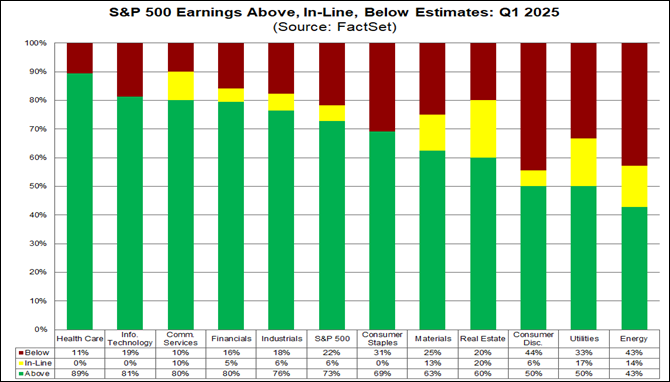
have reported actual results for Q1 2025 to date. Of these companies, 73% have reported actual EPS above estimates, which is below the 5-year average of 77% and below the 10-year average of 75%. In aggregate, companies are reporting earnings that are 10.0% above estimates, which is above the 5-year average of 8.8% and above the 10-year average of 6.9%.”
The chart below shows the breakdown by industry of performance relative to expectations.
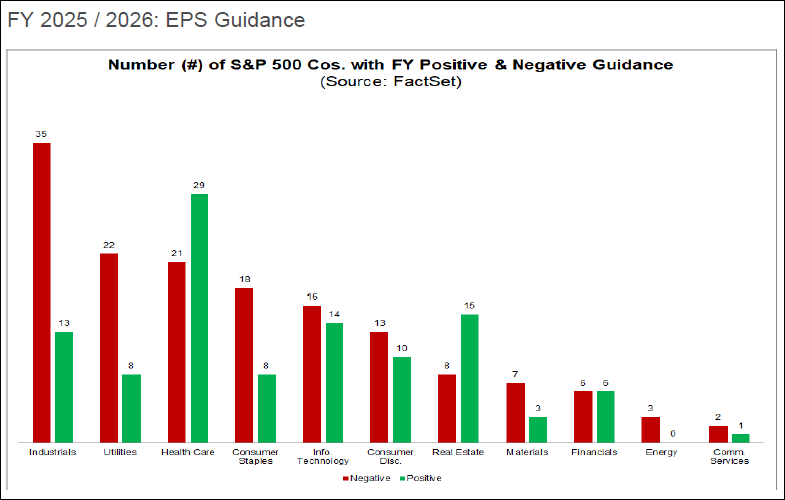
Q1 earnings only matter if guidance for the next year or more is acceptable, especially in periods of uncertainty! So here’s what guidance has been thus far. Remember only a third of S&P 500 companies have reported, and many of the most influential report in the coming weeks.
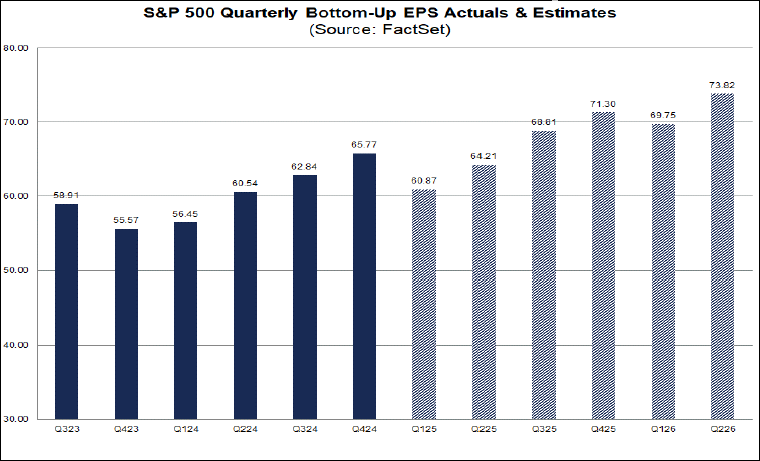
The current expectations are for slightly higher growth for the year with growth moderating in the Mag 7 stocks and increasing in the other 493 stocks. On balance you can see from the chart below that expectations are for a sequential drop in Q1 followed by steady sequential and y/y growth into the end of the year.
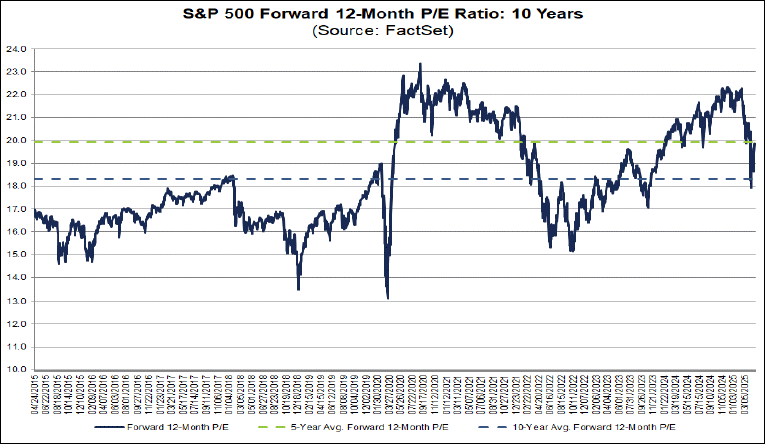
If these estimates can hold up, the forward-looking valuations are reasonable based on the chart below, which shows the forward PE to be under the 5-year average.
Turning back to the weaker dollar, this can have a positive impact on companies that bring profits earned back to the US. It can also lead to more foreign sales as our goods become cheaper to foreigners. Of course, this all assumes that the “sell America” sentiment doesn’t outweigh the benefits of a lower dollar.
According to Factset, 40% of the S&P 500 revenue is international, so it’s a big number.
But What About The Economy?
This Friday we’ll get the biggest employment data of the month – the non-farm payrolls , unemployment rate , and much more. This a “hard data” number, mostly considered to be lagging and not expected to surprise economists.
The challenge with the Friday data will be that there is an increasing belief that the economy is slowing. As you can see by the chart below, economist have been slashing their estimates for
GDP
.
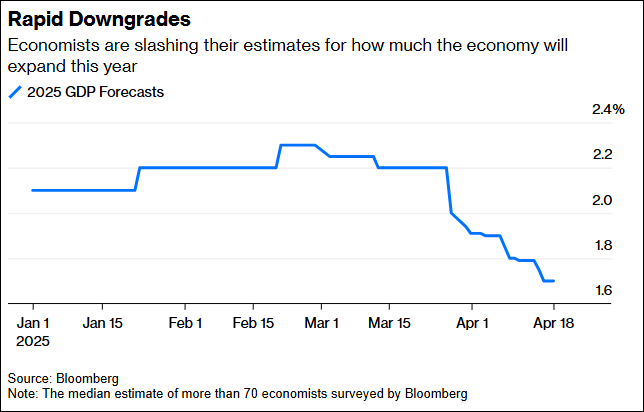
At the same time, there are very mixed soft measures of inflation expectations rising, as you can see in the chart below.
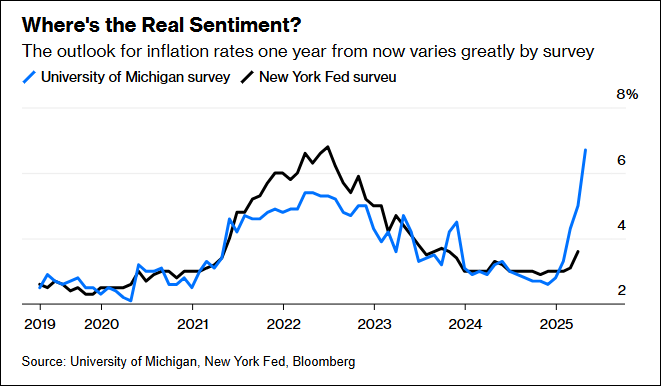
Add to this a Fed that is under attack by the President for not lowering rates, and you have a situation that could be very tough on markets if the unemployment number is weaker than expected.
The Fed has stated that it has several reasons (inflation expectation, a lack of hard data suggesting economic weakness, tariff policy uncertainty) to stick to its desire to hold rates steady until the risk of slowing growth demonstrably outweighs the risk of inflation.
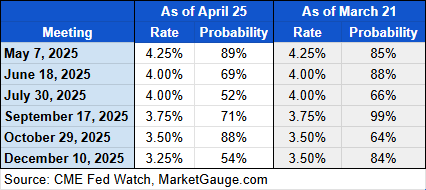
The table below suggests that the market doesn’t think the Fed will move until the June meeting with a 25 basis point cut. Interestingly, despite the increased probabilities voiced by analysts over the last month, the market only anticipates one additional cut by the end of the year, versus expectations a month ago.
Listen To The Market
Weaker-than-expected employment data would lend credibility to increasing concerns of a recession and the probability of achieving the corporate earnings expectations discussed above, so lower stock prices should be expected in this case. You’d also usually expect bonds to rally on weak employment because of a flight to safety and belief in lower future rates, but given the current environment, this relationship should be watched closely.
On the other hand, an “as expected” or slightly stronger than expected employment report should give the Bessent Bounce a boost.
Of course, the report is a full week of earnings reports and White House rhetoric away, and any significant move leading up to the report should be factored into expectations for the market’s reaction.
If the lows of April 9th and the reversal of April 21st represent a real shift in sentiment, the rally could continue with modest earnings data and ‘as expected’ employment data, and a lack of new aggressive trade war rhetoric.
For the first time in months, it feels like the risk may be missing the upside.
One of our market timing models with an impressive track record, Profit Navigator, entered new positions last week. We’ve also increased exposure in other stock-specific models.
In our discretionary trading mentoring sessions, we’ve found a lot of “Tariff Proof” stocks and trends worth trading.
Manage your risk properly, and the upside will take care of itself.
Summary: Longer term, markets remain under pressure in bear phases with extremely high volatility, though we have had a good bounce off the lows and market internals are confirming the recent move. We expect volatility to remain elevated.
Risk On
- Short-term, we saw markets break out positive on price, a mean reversion move. (+)
- Volume patterns confirm the positive price action this week with more accumulation days than distribution. (+)
- All sectors were up this week, led by Technology and Consumer Discretionary, with the exception of Gold Miners and Consumer Staples. (+)
- The McClellan Oscillator flipped strongly positive, though Advance-Declines and Up-Down Volume are overbought. (=)
- New high new low ratio continued to improve and we had confirmation of strength with a new Profit Navigator signal based in part on the ratio.
- The color charts (moving average of stocks above key moving averages) is starting to turn positive on their short-term readings, though still negative on the 50 and 200 day periods. (+)
- Growth is outperforming value on a short-term basis, a reversal of the recent trend. (+)
- Bitcoin both held up better in the crash (acting like a risk-off asset) and recovered with the market this week (acting like a risk-on asset). Our CryptoPulse model caught the rally on strength this week. (+)
- Copper recovered back into a bull phase, a potential signal for strong demand. (+)
- Seasonally, this period tends to be strong, though markets continue to lag their average for this period. (+)
Neutral
- All the key indexes remain in bear phases and are oversold on Real Motion on a longer-time frame. (-)
- Risk gauges improved from strongly negative to neutral. (=)
- Volatility came off significantly with the market rally, but remains elevated over key levels. (=)
- The number of stocks above key moving averages improved off its low, but is overbought on the short-term. (=)
- Foreign equities continued to outperform U.S. markets with more established foreign markets doing particularly well and matching its 2007 highs. (=)
- Gold hit new all-time highs this week before putting in a bearish engulfing pattern, potentially pointing towards continued mean reversion. (=)
- The dollar halted its drop and provided a little more stability to this market. (=)
- Concerns about U.S. debt instruments have abated somewhat but remain elevated in this environment. (=)
- The Modern family had a muted read with Grandma Retail and Tramsports lagging but Semis and Biotech doing well.. (+)
Risk Off
- All the key indexes remain in bear phases and are oversold on Real Motion. (-)
- Soft commodities (DBA) moved into a bullish phase which could indicate continued inflationary pressures. (-)
- Oil is in a bear phase and failed to recover this week with the rest of the market, pointing towards lower demand. (-)
