
USD/CHF Prints New All-Time Low
Another flight to safety by traders and another new all-time low for the USD/CHF.
Another flight to safety by traders and another new all-time low for the USD/CHF.
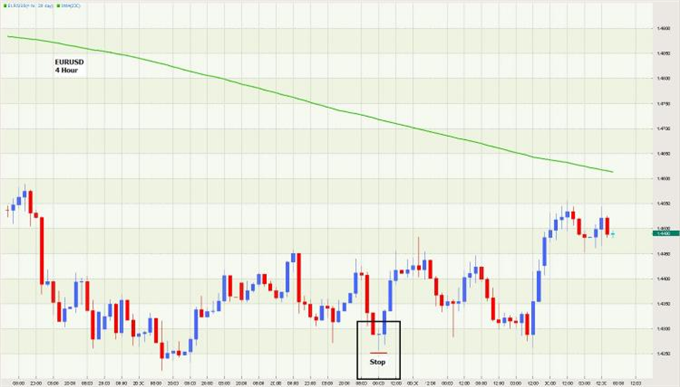
Exactly what kind of trading information does the Doji provide?

Exactly what kind of trading information does the Doji provide?


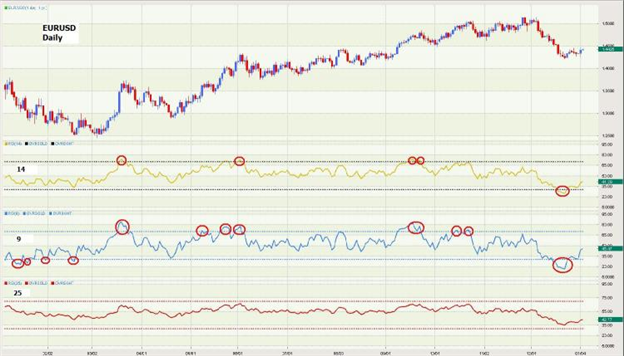
What affect do the various settings have on the sensitivity of the indicator?

What affect do the various settings have on the sensitivity of the indicator?
Looking at several chart time frames on a pair permits a more in depth trade analysis.